um ca. 20 %, heute um 18:30 h beim Index-Stand von ca. 1425.
Anzeige
Meldung des Tages: Während die Autobauer zittern, startet in Südkorea die Massenfertigung – und die Aktie wirkt noch günstig
Neuester,
zuletzt geles. Beitrag
Antworten | Börsen-Forum Übersicht Zurück
Weiter
Zurück
Weiter
... 118 119 121 122 ...
Antworten | Börsen-Forum Übersicht
... 118 119 121 122 ...
Der Doomsday Bären-Thread
Beiträge:
3.607
Zugriffe: 519.796 / Heute: 109
Zugriffe: 519.796 / Heute: 109
|
|
| ||||||||||||||||||||
Werbung
Entdecke die beliebtesten ETFs von SPDR
Der Zins-Chart der 10-jährigen US-Staatsanleihen hat jetzt nachhaltig den Widerstand bei 4,84 % gebrochen (aktuell 4,89 %).
Das schmeckt Aktien-Haltern nicht, insbesondere nicht den Instis...
Das schmeckt Aktien-Haltern nicht, insbesondere nicht den Instis...
Stunde hat zwar noch Luft (hatte als max. 1428-1432 eingeplant)
aber offensichtlich ist die Luft schon vorher raus?
aber offensichtlich ist die Luft schon vorher raus?
(Verkleinert auf 69%) 
nicht short gehen; in Bonds wird das Geld nicht fließen, weil höhere Zinsen erwartet werden, also bleibt es noch im Aktienmarkt, der jetzt allerdings zunehmend nervös wird. Meiner Meinung nach sollte der SP noch mal bis knapp 1450 gehen; dann lohnt es sich für die bigboys, massiv in die andere Richtung ( nach unten ) zu gehen.
(# 2977) und machen die Musik, zu der auch die Big Boyz tanzen müssen. Gegen einen Abwärtstrend zu pushen erfordert extrem viel Geld, das haben selbst die nicht.
Aber selbst das wissen die Amis noch als positiv zu verkaufen: Da eine Million überschüssiger Häuser leer rumstehen, werden die Besitzer sie vermieten müssen, was die Mieten senkt. Dies wiederum soll die CPI-Kerninflation senken.
Der Haken an dieser Logik: Die ehemaligen Hauskäufer zahlen ja Zinsen auf den hohen Kaufpreis. Wenn die Miete die Zinszahlungen nicht deckt, ist das ein auf Dauer kaum tragbares Zuschussgeschäft - zumal wenn auch noch die Hauspreise sinken (so dass es keine Wertsteigerung gibt, die die Kosten auffängt).
ECONOMIC REPORT
Number of vacant homes for sale surges 34%
Homeownership rate unchanged near 69%, Census Bureau says
By Rex Nutting, MarketWatch
Last Update: 3:10 PM ET Jan 29, 2007
WASHINGTON (MarketWatch) -- The number of vacant homes waiting to be sold surged 34% to 2.1 million at the end of 2006 compared with the end of 2005, by far the fastest increase ever recorded, the Census Bureau reported Monday.
A year ago, 1.57 million homes were vacant and awaiting a sale.
The vacancy rate for owned units jumped to a record 2.7% from 2.0% a year earlier. From 1965 to 2005, the homeowner vacancy rate had never been above 2%. The long-term average is 1.4%.
"We have more than a million housing units of excess supply," said James O'Sullivan, an economist for UBS. "If you are looking for evidence that the worst is over for housing, you're not going to find it in this report. This argues that housing starts need to go down more."
In the past 12 months, housing starts have slumped 18% to a seasonally adjusted annual rate of 1.64 million.
In 2006, the number of housing units in the United States rose by 2.14 million, or 1.7%, to 126.7 million. The number of units occupied, however, rose by less than half as much -- 1.04 million.
Meanwhile, the homeownership rate (the percentage of homes occupied by their owners) was essentially steady at 68.9%, the government said, close to the all-time high of 69.3%.
With so many vacant homes for sale, owners will begin to offer them for rent, said Asha Bangalore, an economist for Northern Trust. If the supply of rentals rises, rental prices should begin to come down, helping to bring down core inflation.
"That means a quicker change" in the federal funds overnight interest rate, Bangalore said.
Rents have a double impact on core inflation, because they are used to calculate owners' equivalent rent, which accounts for nearly a fourth of the consumer price index. In 2006, owners' equivalent rents rose 4.3%. Core inflation excluding owners' equivalent rate decelerated to 1.9% in 2006, O'Sullivan said.
Rex Nutting is Washington bureau chief of MarketWatch. 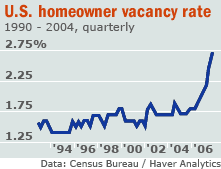
Der Haken an dieser Logik: Die ehemaligen Hauskäufer zahlen ja Zinsen auf den hohen Kaufpreis. Wenn die Miete die Zinszahlungen nicht deckt, ist das ein auf Dauer kaum tragbares Zuschussgeschäft - zumal wenn auch noch die Hauspreise sinken (so dass es keine Wertsteigerung gibt, die die Kosten auffängt).
ECONOMIC REPORT
Number of vacant homes for sale surges 34%
Homeownership rate unchanged near 69%, Census Bureau says
By Rex Nutting, MarketWatch
Last Update: 3:10 PM ET Jan 29, 2007
WASHINGTON (MarketWatch) -- The number of vacant homes waiting to be sold surged 34% to 2.1 million at the end of 2006 compared with the end of 2005, by far the fastest increase ever recorded, the Census Bureau reported Monday.
A year ago, 1.57 million homes were vacant and awaiting a sale.
The vacancy rate for owned units jumped to a record 2.7% from 2.0% a year earlier. From 1965 to 2005, the homeowner vacancy rate had never been above 2%. The long-term average is 1.4%.
"We have more than a million housing units of excess supply," said James O'Sullivan, an economist for UBS. "If you are looking for evidence that the worst is over for housing, you're not going to find it in this report. This argues that housing starts need to go down more."
In the past 12 months, housing starts have slumped 18% to a seasonally adjusted annual rate of 1.64 million.
In 2006, the number of housing units in the United States rose by 2.14 million, or 1.7%, to 126.7 million. The number of units occupied, however, rose by less than half as much -- 1.04 million.
Meanwhile, the homeownership rate (the percentage of homes occupied by their owners) was essentially steady at 68.9%, the government said, close to the all-time high of 69.3%.
With so many vacant homes for sale, owners will begin to offer them for rent, said Asha Bangalore, an economist for Northern Trust. If the supply of rentals rises, rental prices should begin to come down, helping to bring down core inflation.
"That means a quicker change" in the federal funds overnight interest rate, Bangalore said.
Rents have a double impact on core inflation, because they are used to calculate owners' equivalent rent, which accounts for nearly a fourth of the consumer price index. In 2006, owners' equivalent rents rose 4.3%. Core inflation excluding owners' equivalent rate decelerated to 1.9% in 2006, O'Sullivan said.
Rex Nutting is Washington bureau chief of MarketWatch.
Zur Info:
In Australia, the M3 money supply is 13% higher from a year ago, British M4 is 13%higher, the Euro Zone's M3 is 9.3% higher, a 16-year high, Korea's M3 is 10.3% higher, China's M2 is 16.9% higher, a 16-year higher, Russia's M2 is 45% higher, and the US M3 has been reconstructed to show 10.7%growth in 2006."
In Australia, the M3 money supply is 13% higher from a year ago, British M4 is 13%higher, the Euro Zone's M3 is 9.3% higher, a 16-year high, Korea's M3 is 10.3% higher, China's M2 is 16.9% higher, a 16-year higher, Russia's M2 is 45% higher, and the US M3 has been reconstructed to show 10.7%growth in 2006."
Sie werden wie Aktien (long) gehandelt, man geht damit aber Short auf die US-Indizes. Die Charts dieser Short-Index-Aktien laufen natürlich spiegelbildlich zum jeweiligen Index, den sie abbilden. Die Short-Aktie auf den Dow Jones hat das schöne Tickersymbol "DOG". Interessant ist, dass die Index-Short-Aktie auf den SP-500 - Ticker: SH - vor einem Ausbruch nach oben steht (Analyse unten). D. h. umgekehrt, der SP-500 selbst steht vor einem Einbruch. Einige dieser Index-Short-Aktien (sog. Ultra-Shorts) haben auch einen doppelten Hebel, darunter der unten nicht gelistete Nasdaq-Ultrashort-Indexfond mit Ticker QID. Unten der aktuelle Chart von QID (wäre er ein Long, würde Bullen ein "Einstiegssignal" erkennen - Bodenbildung, ansteigendes Volumen). ![]()
Market Confusion Means Time for Protection By Mark Manning Street.com Contributor 1/29/2007 1:04 PM EST |
|
On Friday, I discussed the current health of the market and warned that until we get some clear confirmation that an intermediate-term top is forming, investors should be careful about jumping too quickly to the short side, pointing out specifically what investors should look for and what they should do.
When it comes to shorting stocks or indices to hedge your portfolio, many investors get concerned about the potential risks. With stocks this is a definite concern because of the lack of diversification and unlimited risk if the trade turned against you. The second problem is that you can't do any of this in IRAs because you need a margin account, and that is not allowed in these types of accounts.
Fortunately, there is a very good solution; ProShares has come out with inverse exchange-traded funds called ProShares Short and Ultra-Short Funds. Their short funds seek daily investment results, before fees and expenses, that correspond to the inverse (opposite) of the daily performance of a specific index. The Ultra fund seeks daily investment results, before fees and expenses, that correspond to twice (200%) of the daily performance of a specific index.
With these types of funds, investors have easy trading vehicles to protect their portfolios and make money in a downtrending market. Because ETFs trade like stocks, you can easily set buy and sell stops on your trade. ProShares offers a wide variety of these ETFs from the Dow Jones Industrials to the Small-Cap 600. You can review them on the ProShares Web site.
Today we will look at the charts of three of them, the Short Dow 30 (DOG - commentary - Cramer's Take), Short S&P 500 (SH - commentary - Cramer's Take) and the Short QQQ (PSQ - commentary - Cramer's Take). These three funds will correspond inversely with each index.
The Short Dow 30 has not closed above the 50-day moving average in over six months. However, it looks like it is about ready to do that. On Friday it broke through that level, but closed slightly below. A good buy point for this fund would be above resistance at $63.32. I would then make sure I had a protective sell stop under the $62.00 area if the Dow turns around and ramps higher again.

The Short S&P Fund is also very close to breaking out of its two-month consolidation, and it has successfully held above the 50-day moving average. A break above Friday's high at $63.12 may be a good entry point. Again, I would make sure I had a sell stop underneath support.

If the market does put in some type of top here, the Nasdaq Composite and the Qs look like they may lead the way down. They, too, successfully held above the 50-day moving average last week after the false breakout in the Nasdaq two weeks ago. You could actually use two buy points on this index. The first one would be above Friday's high of $ 63.02 and then again above $64.00. A good place for a protective sell stop would be under last Thursday's low of $61.35.

These are just a few ways you can outright short the market or protect your long-term holdings by hedging your portfolio from a correction. There are many other indices ProShares covers, including going 200% short these indexes. You will have to review them and see what is best for your individual circumstances.
Hier der Chart der Nasdaq-Ultrashort-Index-Aktie QID
(Verkleinert auf 96%)
Unten der aktuelle Chart von QID (wäre er ein Long, würde Bullen ein "Einstiegssignal" erkennen - Bodenbildung, ansteigendes Volumen).
Das Tragische Anti Lemming 28.01.07 18:07
an reinen Charttechnikern ist ja, dass sie gar nicht wissen, ob sie mit Äpfeln, Birnen oder Zitronen handeln, weil Fundamentalanalyse über ihren Horizont geht. Wer lediglich reflexhaft auf Bewegungen reagiert, die Andere verursachen, kann per Definition nicht besser abschneiden als die Masse. Und die verdient an der Börse bekanntlich kein Geld.
Im Umkehrschluss soll das wohl heissen der S&P geht weiter hoch nach Deiner Definition, das Charttechniker nur verlieren*ggg*
Moin,
die Ansicht, dass Charttechnik eine reflexhafte Reaktion
auf Marktbewegungen ist, ist meines Erachtens und der Ansicht
der meisten Chartisten schlichtweg falsch.
Charttechnik ist das suchen (und finden) bekannter Chartformationen
und das Wissen um Ihre Auswirkungen. Bzw. um die Reaktionen der Kurse
noch bevor es die Masse durch Fundamentals oder spekulation sieht.
Es ist somit eine rein Mathematisch-wissenschafliche Betrachtung des
Marktes.
meine Diagnose zum chart des QID steigt er jetzt wieder über
die Marke von 55 setzte eine Aufwärtsbewegung ein
Woodstore
-----------------------------------
Großes fällt in sich selbst zusammen: Diese Beschränkung des Wachstums hat der göttliche Wille dem Erfolg aufgelegt.
The Short View: US profits
By Tony Tassell
Published: January 29 2007 19:01 | Last updated: January 29 2007 19:01
The streak may not yet be over. After a record-matching 13 quarters of earnings growth above 10 per cent, analysts had expected the US corporate sector’s fourth-quarter results at last to reveal a slowdown to single-digit increases.
But gravity continues to be defied. With results for 203 of the S&P 500 companies in, the expected growth for the first quarter had risen steadily to reach exactly 10 per cent by last night, according to consensus forecasts compiled by Thomson Financial.
Companies have also been adroit in what has become a quarterly earnings numbers game of guiding the market lower and then beating the forecasts. About 68 per cent of the reported fourth-quarter results have beaten forecasts – in line with recent quarters.
But there are reasons for the equity market to worry. Streaks don’t last forever and Thomson Financial says the forecast growth rate for 2007 has slipped from the 9.3 per cent expected on January 1 to 7.8 per cent. It is early days but the level of negative announcements on the outlook for first-quarter results has also been higher than in recent quarters.
Even the fourth-quarter results have relied heavily on Wall Street and the insurance industry. The insurance sector, benefiting from reduced hurricane activity, shot out the lights in the fourth quarter. The "multi-line" insurance sector is expected to deliver earnings growth of 349 per cent for the period. The investment banks, buoyed by trading profits and corporate deal activity, are expected to see a 53 per cent rise.
If the financials sector is excluded from the S&P 500 index, Thomson Financial says the expected earnings growth falls to just 1.7 per cent for the fourth quarter. That does not augur well, even if the overall level is dragged down by the energy sector. If energy is removed from the S&P 500 index, the expected earnings growth rate for the remaining nine sectors would be 14 per cent.
Analysts may once again prove pessimistic, as they have been in recent years. But even a modestly slowing earnings growth rate is hardly a positive backdrop for equities.
http://www.ft.com/cms/s/fcbf01e2-afc8-11db-94ab-0000779e2340.html
Der ganze Doomsday-Bären-Thread basiert auf fundamentaler Analyse mit einigen Chartanalysen als Begleitmusik. Wir beide hatten uns ja bereits vorgestern verständigt, dass eine Mischung aus beidem eine solide Ausgangsbasis ist.
Meine Short-Haltung zum S&P-500 basiert ganz eindeutig NICHT auf Charttechnik, sondern auf der Analyse fundamentaler Fakten - hier im Thread ja weit und breit ausgeführt.
"Wir" hier im Thread (bis auf die Stänker) wissen daher sehr wohl, womit wir handeln, und reagieren nicht reflexhaft wie Blindfische auf erratische Zuckungen im Apfel-, Birnen- oder Zitronen-Chart, wie es ja im TTT-Thread gang und gäbe ist (dort liest man selten was Fundamentales, ist eher eine Lotto-Tipp-Gemeinschaft mit Zeithorizont von wenigen Minuten bis zu einigen Stunden).
Die Ausgangslage ist jedoch völlig anders, wenn ich fundamental eine These aufgestellt habe, und DANACH in Charts nach ihrer Bestätigung suche. Das ist grundverschieden von dem im vorigen Absatz beschriebenen, stochastisch aufgemotzten Blind-Getippe.
FAZIT: Chart-Technik zur Verfizierung fundamentaler Thesen finde ich gut und praktikabel. Ich freue mich daher auch über entsprechende Postings hier im Thread, etwa von Pfeifenlümmel und Platschquatsch (z. B. # 2978)
"Charttechnik ist das suchen (und finden) bekannter Chartformationen
und das Wissen um Ihre Auswirkungen. Bzw. um die Reaktionen der Kurse
noch bevor es die Masse durch Fundamentals oder spekulation sieht."
Falsch. IMHO kommen Trendwenden im Chart, weil Insider oder gut Eingeweihte über kommende fundamentale Probleme oder Verbesserungen informiert sind. Die Trendwende erfolgt daher fundamental. Erst NACHDEM sie vollzogen ist, werden Charttechniker auf sie aufmerksam. Sie stehen daher in der 2. Reihe - und REAGIEREN.
Die Behauptung, Chartechniker würden den Trend setzen, ist Unfug. Das gilt allenfalls für die Big Boyz, die an charttechnisch interessanten Stellen ihre Future-Buy-Programme anwerfen. Die Macht dieser Leute ist aber ihre Finanzmacht, nicht das Chart-Wissen.
Freut mich, dass Du aufgrund des Charts bei QID den Ausbruch bestätigst (was bezogen auf die Nasdaq ein Short-Signal ist). Man muss aber berücksichtigen, dass QID erst seit wenigen Monaten auf dem Markt und daher nicht sehr bekannt ist. Das steigende Volumen könnte auch eine Folge wachsender Bekanntheit/Beliebtheit von QID sein.
Glückwunsch zum exakt einjährigen Bestehen des Threads.
Der Bär ist stärker als sein Ruf! :))
Ich hatte gestern mal wieder die Telebörse auf n-Tv gesehen. Was wurde da rumgeheult von wegen DOW so schwach und soweiter. Die Moderatorin fragte bei der Schaltung an die Wall Street "Was ist bei Ihnen da los, der DOW macht so einen lustlosen Eindruck (der DOW lag zu diesem Zeitpunkt mit 50 Punkten im Plus)"
Ich hatte gestern mal wieder die Telebörse auf n-Tv gesehen. Was wurde da rumgeheult von wegen DOW so schwach und soweiter. Die Moderatorin fragte bei der Schaltung an die Wall Street "Was ist bei Ihnen da los, der DOW macht so einen lustlosen Eindruck (der DOW lag zu diesem Zeitpunkt mit 50 Punkten im Plus)"

"Wir" hier im Thread (bis auf die Stänker) wissen daher sehr wohl, womit wir handeln, und reagieren nicht reflexhaft wie Blindfische auf erratische Zuckungen im Apfel-, Birnen- oder Zitronen-Chart, wie es ja im TTT-Thread gang und gäbe ist (dort liest man selten was Fundamentales, ist eher eine Lotto-Tipp-Gemeinschaft mit Zeithorizont von wenigen Minuten bis zu einigen Stunden)."
dann brauchen wir uns nicht weiter unterhalten, da das eindeutig nur durch Vorurteile und Effekthascherei untermauert ist. Bis jetzt ist dieser Thread aber auch nur eine Lotto-Tipp Gemeinschaft, da nur immer wieder gebetsmühlenhaft alles negative gepostet wird, da der Markt ja fallen muss.
Es gibt Trader die mit Charttechnik wenige Sekunden handeln, aber wenn der TTT als Vergleich hergezogen wird kann ich nur lachen, da dort mit Sicherheit weder fundamentales noch charttechnisches Wissen vorhanden ist.
Dort gibt es auch Trader die seit 5500 Woche für Woche short schreien aus fundamentalen und charttechnischen Gesichtspunkten und den Markt leider nicht ernst nehmen.
Aber am Ende muss jeder selbst wissen was er macht, den Erfolg kann man dann am Kontostand ablesen.
In diesem Sinne viel Erfolg.
Deine Kritik an der Mehrzahl der Postings im TTT-Thread teile ich, und was ich dazu geschrieben habe, ist eine Art "Karikatur" - schwer überzeichnet, aber nicht ganz an der Realität vorbei. Ganz so krass, wie ich es ausgedrückt habe, meine ich es nicht.
Was diesen Thread betrifft: Wir sammeln hier negative News und erwarten eine Korrektur nach unten, stimmt auch. Dazu ist dieser Thread aber auch gedacht. Positive News poste ich woanders, z. B. im Intel- oder Pfizer-Thread (beides Long-Threads). Dass die Sichtweise hier einseitig "nur negativ" sei, trifft beschränkt zu (es gibt auch viele Bullen, die hier Gegenargumente posten), andererseits wird damit schlicht "das Thema getroffen". Ist halt ein Bären-Thread.
Wahr ist, dass die hier im Thread erwartete Korrektur trotz vieler negativer Indikatoren bislang ausgebliebenen ist. Das ist freilich kein Beweis dafür, dass die Thesen nicht zutreffen. Dass der Markt negative News seit langem schlicht ignoriert [auch aus charttechnischen Gründen, Dir zur Ehre ;-) ], verwundert inzwischen selbst die Bullen. Viele Bullen hatten letztes Jahr geradezu auf eine Korrektur GEHOFFT, damit Neukäufer nicht immer nur riskante Positionen in hyperbolische Anstiege hinein eingehen müssen.
In diesem Jahr ist die Bären-These ja nur einmal von Mai bis Juli aufgegangen, danach gab es kein Follow-through nach unten. Nach zuvor 3 Jahren Non-stop-Anstieg war aber auch nicht mit einer prompten "Kehrtwende auf dem Absatz" zu rechnen. Topbildung ist oft ein noch langwierigerer Prozess als Bodenbildung. In den letzten Wochen kann man aber mit einigem guten Willen auch schon charttechnisch eine Topbildung ausmachen, vor allem die scharfen Intraday-Reversals der letzten Tage sind für die Bullen kein gutes Zeichen.
Dies bestätigen inzwischen auch Charttechniker (# 2983/2985), die den Chart von QID (Nasdaq-short-Indexaktie) als bullisch bezeichnen (= bärisch für die Nasdaq).
Dies bestätigen inzwischen auch Charttechniker (# 2983/2985), die den Chart von QID (Nasdaq-short-Indexaktie) als bullisch bezeichnen (= bärisch für die Nasdaq).
wie man fundamentale Analyse mit Chartanalyse hervorragend verbinden kann.
Früher oder später werden sich beide Methoden parallel zueinander entwickeln und deshalb ist es von Vorteil wenn man beides miteinander verbindet.
Hier hat die Charttechnik mit dem W die fundamentalen Meldungen aber schon vorweggenommen gehabt.
Früher oder später werden sich beide Methoden parallel zueinander entwickeln und deshalb ist es von Vorteil wenn man beides miteinander verbindet.
Hier hat die Charttechnik mit dem W die fundamentalen Meldungen aber schon vorweggenommen gehabt.
Hier haben offenbar Insider, die von der News bereits intern erfahren haben, gekauft, bevor die News veröffentlicht wurde. Das "Fundamentale" ist der in der News genannte "Fakt", nicht der Zeitpunkt der News-Veröffentlichung.
Die Reihenfolge lautet daher:
Fakt wird intern bekannt -> Insider kaufen -> Kurs steigt -> News zum Fakt wird veröffentlicht -> die Öffentlichkeit kauft
Der Fakt/"das Fundamentale" steht dabei am Anfang und ist der eigentliche Kaufauslöser.
Die Reihenfolge lautet daher:
Fakt wird intern bekannt -> Insider kaufen -> Kurs steigt -> News zum Fakt wird veröffentlicht -> die Öffentlichkeit kauft
Der Fakt/"das Fundamentale" steht dabei am Anfang und ist der eigentliche Kaufauslöser.
aber AL das Angebot steht nach wie vor, zum Bärenjäger, Steaks spendier ich die Bären haben genug gelitten ...
Gruß
nuessa
www.chartchancen.eu
Gruß
nuessa
www.chartchancen.eu
Viel zu holen war für die Bullen in den letzten zwei Monaten ja auch nicht, gerade mal 20 Punkte im SP-500 (= 1,4 %). Falls heute noch so ein Down-Day kommt wie am 25., ist die Bilanz sogar Null.
(Chart des SP-500)
(Chart des SP-500)
(Verkleinert auf 96%)
Das Put-Call-Verhältnis in USA steht zurzeit auf einem Tief. Der Trend dieser Tiefs liegt allerdings auf einer aufsteigenden Linie. Als der P/C-Chart das letzte Mal auf dieser Linie aufsetzte (Mai 2006), folgte ein Abverkauf, ebenso bei den anderen Tiefs davor.
Wird es diesmal ebenso laufen? Der Chart-Punkt dafür wäre jedenfalls erreicht.
Wird es diesmal ebenso laufen? Der Chart-Punkt dafür wäre jedenfalls erreicht.
(Verkleinert auf 76%)
aber einigen kritischen Anmerkungen sei die Erlaubnis erteilt :
Bedankt an dieser Stelle !
Inflation and War Finance
January 29, 2007
The Pentagon recently reported that it now spends roughly $8.4 billion per month waging the war in Iraq, while the additional cost of our engagement in Afghanistan brings the monthly total to a staggering $10 billion. Since 2001, Congress has spent more than $500 billion on specific appropriations for Iraq. This sum is not reflected in official budget and deficit figures. Congress has funded the war by passing a series of so-called "supplemental" spending bills, which are passed outside of the normal appropriations process and thus deemed off-budget.
This is fundamentally dishonest: if we’re going to have a war, let’s face the costs-- both human and economic-- squarely. Congress has no business hiding the costs of war through accounting tricks.
As the war in Iraq surges forward, and the administration ponders military action against Iran, it’s important to ask ourselves an overlooked question: Can we really afford it? If every American taxpayer had to submit an extra five or ten thousand dollars to the IRS this April to pay for the war, I’m quite certain it would end very quickly. The problem is that government finances war by borrowing and printing money, rather than presenting a bill directly in the form of higher taxes. When the costs are obscured, the question of whether any war is worth it becomes distorted.
Congress and the Federal Reserve Bank have a cozy, unspoken arrangement that makes war easier to finance. Congress has an insatiable appetite for new spending, but raising taxes is politically unpopular. The Federal Reserve, however, is happy to accommodate deficit spending by creating new money through the Treasury Department. In exchange, Congress leaves the Fed alone to operate free of pesky oversight and free of political scrutiny. Monetary policy is utterly ignored in Washington, even though the Federal Reserve system is a creation of Congress.
The result of this arrangement is inflation. And inflation finances war.
Economist Lawrence Parks has explained how the creation of the Federal Reserve Bank in 1913 made possible our involvement in World War I. Without the ability to create new money, the federal government never could have afforded the enormous mobilization of men and material. Prior to that, American wars were financed through taxes and borrowing, both of which have limits. But government printing presses, at least in theory, have no limits. That’s why the money supply has nearly tripled just since 1990.
For perspective, consider our ongoing military commitment in Korea. In Korea alone, U.S. taxpayers have spent $1 trillion in today’s dollars over 55 years. What do we have to show for it? North Korea is a belligerent adversary armed with nuclear weapons, while South Korea is at best ambivalent about our role as their protector. The stalemate stretches on with no end in sight, as the grandchildren and great-grandchildren of the men who fought in Korea give little thought to what was gained or lost. The Korean conflict should serve as a cautionary tale against the open-ended military occupation of any region.
The $500 billion we’ve officially spent in Iraq is an enormous sum, but the real total is much higher, hidden within the Defense Department and foreign aid budgets. As we build permanent military bases and a $1 billion embassy in Iraq, we need to keep asking whether it’s really worth it. Congress should at least fund the war in an honest way so the American people can judge for themselves.
Es gibt keine neuen Beiträge.
|
Neueste Beiträge aus dem BP Forum
| Wertung | Antworten | Thema | Verfasser | letzter Verfasser | letzter Beitrag | |
| 58 | 19.306 | BP Group | B.Helios | Heute1619 | 08.01.26 11:14 | |
| 43 | BP im Wandel | Tom1313 | Tom1313 | 02.08.22 08:44 | ||
| 80 | 3.606 | von nun an gings bergauf | 123p | 123p | 05.12.21 09:12 | |
| 5 | 170 | BP on the long run 850517 | Blackadder | Blackadder | 25.04.21 13:27 | |
| 2 | 143 | Ist BP unterbewertet? | Salim R. | HSO50 | 25.04.21 03:50 |