welcher sich fast exakt von links unten nach rechts oben erstreckt, so könnte man mit Blick auf das beigefügte Bild annehmen.
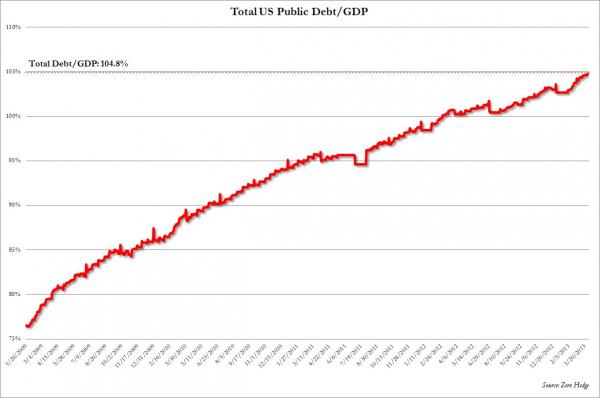
Allerdings handelt es sich hier um den US-Schuldenanstieg der vergangenen vier Jahre in Relation zum Gross Domestic Product.
Total US Debt To GDP: 105%
Now that we have the first estimate of Q1 GDP growth in both rate of change and absolute current dollar terms ($16,010 billion), we can finally assign the appropriate debt number, which we know on a daily basis and which was $16,771.4 billion as of March 31, to the growth number. The end result: as of March 31, 2013, the US debt/GDP was 104.8%, up from 103% as of December 31, 2012 or a debt growth rate that would make the most insolvent Eurozone nation blush. There was a time when people were concerned about this unsustainable trajectory, but then there was an infamous excel error, and now nobody cares anymore.
In fact, moar debt is moar best-er.
www.zerohedge.com/news/2013-04-26/total-us-debt-gdp-105
(Verkleinert auf 93%)

Bubbles are normal and non-bubble times are depressions!
 Werbung


