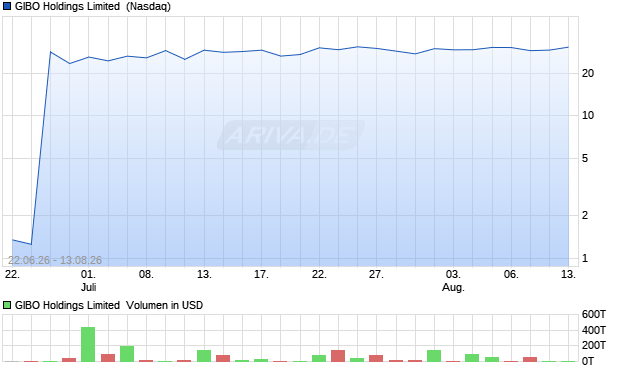
| Geld/Brief | 20,80 $ / 45,47 $ |
| Spread | +118,61% |
| Schluss Vortag | 30,24 $ |
| Gehandelte Stücke | 2.753 |
| Tagesvolumen Vortag | 53.812,52 $ |
| Tagestief 28,76 $ Tageshoch 30,50 $ | |
| 52W-Tief - 52W-Hoch 28,76 $ | |
| Jahrestief - Jahreshoch 28,76 $ | |
| Umsatz in Mio. | - |
| Operatives Ergebnis (EBIT) in Mio. | -131,96 $ |
| Jahresüberschuss in Mio. | -231,91 $ |
| Umsatz je Aktie | - |
| Gewinn je Aktie | -96,36 $ |
| Gewinnrendite | - |
| Umsatzrendite | - |
| Return on Investment | -27.815,84% |
| Marktkapitalisierung in Mio. | 75,80 $ |
| KGV (Kurs/Gewinn) | - |
| KBV (Kurs/Buchwert) | - |
| KUV (Kurs/Umsatz) | - |
| Eigenkapitalrendite | - |
| Eigenkapitalquote | -17.315,68% |

| Handelsplatz | Letzter | Änderung | Vortag | Zeit | |
|---|---|---|---|---|---|
| AMEX | 1,345 $ | - | - | 22.06.26 | |
| Nasdaq | 28,76 $ | -4,89% | 30,24 $ | 07.08.26 | |
| NYSE | 1,345 $ | - | - | 22.06.26 | |
| Datum | Kurs | Volumen |
|---|---|---|
| 07.08.26 | 28,76 | 54 T |
| 06.08.26 | 30,24 | 3.040 |
| 05.08.26 | 30,29 | 53 T |
| 04.08.26 | 29,18 | 87 T |
| 03.08.26 | 29,16 | 583 |
| Zeitraum | Kurs | % |
|---|---|---|
| 1 Woche | 29,70 $ | -3,16% |
| 1 Monat | 26,30 $ | +9,35% |
| 6 Monate | - | - |
| 1 Jahr | - | - |
| 5 Jahre | - | - |
| Marktkapitalisierung | 75,80 Mio. $ |
| Streubesitz | 1.135,67% |
| Währung | USD |
| Land | USA |
| Sektor | Kommunikation |
| Branche | Elektronische Medien |
| Aktientyp | Stammaktie |
| +0,03% | Morgan Stanley - Brokerage Accounts |
| +0,02% | XTX Topco Ltd |
| +0,01% | UBS Group AG |
| 0,00% | Fidelity Nasdaq Composite Index |
| 0,00% | Caitong International Asset Management Co., Limited. |
| 0,00% | Citadel Advisors Llc |
| 0,00% | Citigroup Inc |
| 0,00% | JPMorgan Chase & Co |
| 0,00% | TWO SIGMA SECURITIES, LLC |
| +0,08% | Institutionelle Aktionäre |
| +1.135,67% | Streubesitz |
| +1.135,59% | Individuelle Aktionäre |