Anzeige
Meldung des Tages: Freitagabend nachbörslich veröffentlicht – was der Markt erst am Montag sieht
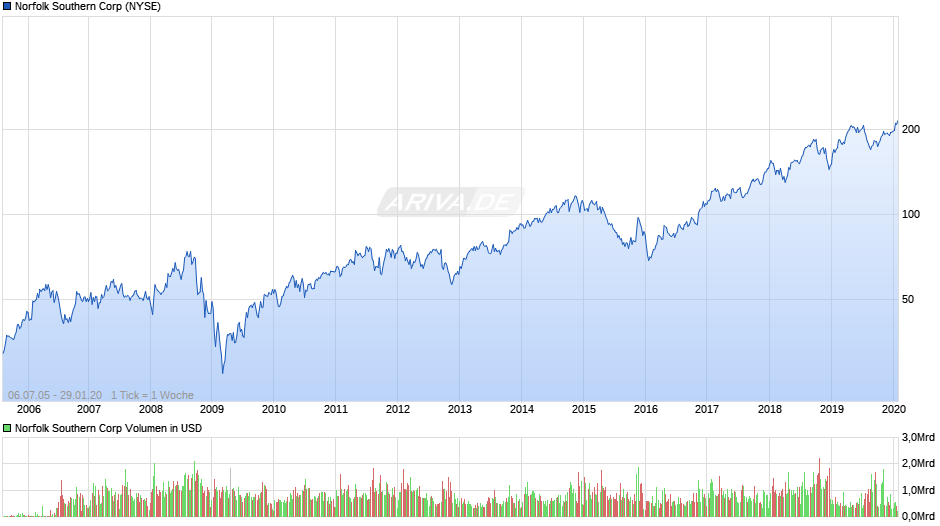
Norfolk Southern Aktie
Aktie
246.0
246,00 €
+0,00 €
0,00%
10:47:52 Uhr
Depot/Watchlist
Weiter aufwärts?
Long handeln
-
Jetzt mit Hebel 10,84:
VK7RHM
Werbung
- Übersicht
- Kurse
- Chart
- Kennzahlen
- Unternehmen
- News
- Forum
- Nachhaltigkeit
- Anlageprodukte
- Push
- Intraday
- 1W+1,23%
- 3M+0,41%
- 6M+0,41%
- 1J
- 5J+24,27%
- Gesamt+320,20%


Realtime-Kursdaten
| Geld/Brief | 244,00 € / 248,00 € |
| Spread | +1,64% |
| Schluss Vortag | 246,00 € |
| Gehandelte Stücke | 0 |
| Tagesvolumen Vortag | - |
| Tagestief 246,00 € Tageshoch 246,00 € | |
| 52W-Tief 181,50 € 52W-Hoch 263,00 € | |
| Jahrestief 235,00 € Jahreshoch 254,00 € | |
zur Handelsplatz-Übersicht »
News
NEU
Kostenloser Report:
Diese 3 Werte könnten jetzt explodieren!
Diese 3 Werte könnten jetzt explodieren!
29.01.26
PR Newswire
27.01.26
PR Newswire
27.01.26
PR Newswire
Weitere News »
Fundamentale Kennzahlen (2024)
| Umsatz in Mio. | 12.123 $ |
| Operatives Ergebnis (EBIT) in Mio. | 3.764 $ |
| Jahresüberschuss in Mio. | 2.622 $ |
| Umsatz je Aktie | 53,52 $ |
| Gewinn je Aktie | 11,58 $ |
| Gewinnrendite | +18,33% |
| Umsatzrendite | +21,63% |
| Return on Investment | +6,00% |
| Marktkapitalisierung in Mio. | 53.160 $ |
| KGV (Kurs/Gewinn) | 20,27 |
| KBV (Kurs/Buchwert) | 3,72 |
| KUV (Kurs/Umsatz) | 4,39 |
| Eigenkapitalrendite | +18,33% |
| Eigenkapitalquote | +32,75% |
Derivate
Anlageprodukte (8)
| Discount-Zertifikate | 8 |
Hebelprodukte (293)
| Optionsscheine | 191 | |
| Faktor-Zertifikate | 78 | |
| Knock-Outs | 13 | |
| Capped Optionssch. | 11 |
Dividenden Kennzahlen
| Auszahlungen/Jahr 4 |
| Keine Senkung seit 24 Jahre |
| Stabilität der Dividende 0,97 (max 1,00) |
| Jährlicher 6,73% (5 Jahre) Dividendenzuwachs 9,63% (10 Jahre) |
| quote 57,8% (auf den Free Cash Flow) |
| Erwartete Dividendensteigerung 1,11% |
Dividenden Historie
| Datum | Dividende |
| 07.11.2025 | 1,35 $ (1,17 €) |
| 01.08.2025 | 1,35 $ (1,18 €) |
| 02.05.2025 | 1,35 $ (1,20 €) |
| 07.02.2025 | 1,35 $ (1,30 €) |
| 01.11.2024 | 1,35 $ (1,24 €) |
| 02.08.2024 | 1,35 $ (1,25 €) |
| 02.05.2024 | 1,35 $ (1,26 €) |
| 01.02.2024 | 1,35 $ (1,25 €) |
alle Dividenden & Splits »
Werbung
Mehr Nachrichten kostenlos abonnieren
E-Mail-Adresse
Bitte überprüfe deine die E-Mail-Adresse.
Benachrichtigungen von ARIVA.DE
(Mit der Bestellung akzeptierst du die Datenschutzhinweise)
(Mit der Bestellung akzeptierst du die Datenschutzhinweise)

Vielen Dank, dass du dich für unseren Newsletter angemeldet hast. Du erhältst in Kürze eine E-Mail mit einem Aktivierungslink.
Leider können wir deine Anfrage auf diesem Weg nicht entgegennehmen.
Bitte schreibe uns an: portal.support@ariva.de
Bitte schreibe uns an: portal.support@ariva.de
Termine
| 31.03.2026 | Quartalsmitteilung |
Quelle: Leeway
Prognose & Kursziel
Keine aktuellen Prognosen oder Kursziele bekannt.
Übersicht Handelsplätze
| Handelsplatz | Letzter | Änderung | Vortag | Zeit | |
|---|---|---|---|---|---|
| Düsseldorf | 238,00 € | +1,71% | 234,00 € | 30.01.26 | |
| Frankfurt | 240,00 € | +1,69% | 236,00 € | 30.01.26 | |
| Hamburg | 242,00 € | +0,83% | 240,00 € | 30.01.26 | |
| Hannover | 242,00 € | +0,83% | 240,00 € | 30.01.26 | |
| München | 240,00 € | +1,69% | 236,00 € | 30.01.26 | |
| Stuttgart | 244,00 € | +0,83% | 242,00 € | 30.01.26 | |
| Xetra | 244,00 € | +0,83% | 242,00 € | 30.01.26 | |
| L&S RT | 246,00 € | 0 % | 246,00 € | 10:47 | |
| NYSE | 291,24 $ | +0,37% | 290,16 $ | 30.01.26 | |
| Nasdaq | 291,36 $ | +0,41% | 290,165 $ | 30.01.26 | |
| AMEX | 291,51 $ | +0,37% | 290,44 $ | 30.01.26 | |
| Wien | 244,00 € | +0,83% | 242,00 € | 30.01.26 | |
| Tradegate | 242,00 € | -0,82% | 244,00 € | 30.01.26 | |
| Quotrix | 242,00 € | +1,68% | 238,00 € | 30.01.26 | |
| Gettex | 244,00 € | +0,83% | 242,00 € | 30.01.26 | |
Historische Kurse
| Datum | Kurs | Volumen |
|---|---|---|
| 31.01.26 | 246,00 | - |
| 30.01.26 | 246,00 | - |
| 29.01.26 | 244,00 | - |
| 28.01.26 | 237,00 | - |
| 27.01.26 | 241,00 | - |
| 26.01.26 | 242,00 | - |
Performance
| Zeitraum | Kurs | % |
|---|---|---|
| 1 Woche | 243,00 € | +1,23% |
| 1 Monat | 249,00 € | -1,20% |
| 6 Monate | 245,00 € | +0,41% |
| 1 Jahr | 246,00 € | 0,00% |
| 5 Jahre | 197,96 € | +24,27% |
Unternehmensprofil Norfolk Southern Corp

Die Norfolk Southern Corporation ist zusammen mit ihren Tochtergesellschaften im Schienentransport von Rohstoffen, Zwischenprodukten und Fertigwaren in den Vereinigten Staaten tätig. Das Unternehmen transportiert Landwirtschafts-, Forst- und Konsumgüter wie Sojabohnen, Weizen, Mais, Düngemittel, Vieh- und Geflügelfutter, Lebensmittel, Speiseöle, Mehl, Süßstoffe, Ethanol, Holz und Holzprodukte, Zellstoffplatten und Papierprodukte, Holzfasern, Zellstoff, Getränke und Konserven; Chemikalien, darunter Schwefel und verwandte Chemikalien, Erdölprodukte wie Rohöl, Chlor und Bleichmittel, Kunststoffe, Kautschuk, Industriechemikalien, chemische Abfälle, Sand und flüssiges Erdgas; Metalle und Baumaterialien wie Stahl, Aluminiumprodukte, Maschinen, Metallschrott, Zement, Zuschlagstoffe, Mineralien, Ton, Transportausrüstungen und militärische Produkte; und Kraftfahrzeuge, einschließlich fertiger Kraftfahrzeuge und Kraftfahrzeugteile, sowie Kohle. Darüber hinaus befördert das Unternehmen Fracht aus Übersee über verschiedene Häfen an der Atlantik- und Golfküste, bietet Personenbeförderungsdienste im Nahverkehr an und betreibt ein intermodales Netzwerk. Zum 31. Dezember 2022 betrieb das Unternehmen rund 19.100 Streckenkilometer in 22 Bundesstaaten und dem District of Columbia. Die Norfolk Southern Corporation wurde 1980 gegründet und hat ihren Hauptsitz in Atlanta, Georgia.
Stammdaten
| Marktkapitalisierung | 55,92 Mrd. € |
| Aktienanzahl | 226,24 Mio. |
| Streubesitz | 21,46% |
| Währung | EUR |
| Land | USA |
| Sektor | Industrie |
| Branche | Straßen- u. Schienenverkehr |
| Aktientyp | Stammaktie |
Aktionärsstruktur
| +0,35% | Interval Partners, LP |
| +78,19% | Weitere |
| +21,46% | Streubesitz |
Community-Beiträge zu Norfolk Southern Corp
Ergebnis
Aktie des Tages
neues ATH
Value Man
...
und es geht weiter ab bei den Eisenbahnen. Norfolk Souther konnte positiv überraschen ( http://www.valueblog.de/?p=502 ) Noch beindurckender war aber Kansas City Southern, da läuft wirklich was mit Mexiko :) .
Peddy78
Weiterhin irgendwie Vorbild für die Deutsche Bahn.
Stillstand und nichts geht mehr.
Norfolk Southern verbucht Umsatz- und Gewinnrückgang
15:24 24.10.07
Norfolk (aktiencheck.de AG) - Die amerikanische Norfolk Southern Corp. (ISIN US6558441084/ WKN 867028) musste im dritten Quartal 2007 ein Minus bei Umsatz und Ergebnis ausweisen.
Wie die viertgrößte Eisenbahngesellschaft in den USA am Mittwoch mitteilte, sank der Umsatz um 1,7 Prozent auf 2,35 Mrd. Dollar, im Vergleich zum Vorjahreswert von 2,39 Mrd. Dollar.
Der Nettogewinn fiel um 7 Prozent von 416 Mio. Dollar bzw. 1,02 Dollar je Aktie auf nun 386 Mio. Dollar bzw. 0,97 Dollar je Aktie. Eine Veränderung des Steuerrechts hat das Ergebnis um 5 Cents pro Anteilschein belastet. Analysten hatten zuvor ein EPS von 1,02 Dollar sowie einen Umsatz von 2,41 Mrd. Dollar geschätzt.
Für das laufende vierte Quartal 2007 liegen die Analystenschätzungen bei einem EPS von 0,99 Dollar sowie einem Umsatz von 2,42 Mrd. Dollar.
Die Aktie schloss gestern an der NYSE bei 54,00 Dollar (+2,54 Prozent). (24.10.2007/ac/n/a)
Quelle: aktiencheck.de
Peddy78
Zug vor der Nase abgefahren.Norfolk Vorbild fürDB
Transportkonzern übertrifft Prognosen deutlich
25.10.06 14:50
Der Eisenbahnbetreiber Norfolk Southern Corp. erwirtschaftete im dritten Quartal einen Nettogewinn von 416 Millionen Dollar bzw 1,02 Dollar je Aktie. Im Vergleichszeitraum des Vorjahres wies Norfolk einen Gewinn von 301 Millionen Dollar bzw 73 Cents je Aktie aus. Die Erlöse stiegen um 11% auf 2,39 Milliarden Dollar. Die von Thomson First Call erhobenen durchschnittlichen Analystenschätzungen liegen bei einem Gewinn von 81 Cents und Erlösen von 2,36 Milliarden Dollar.
Quelle: BoerseGo
Artikel drucken
&a=867028&zeitraum=5&bname=&ind_news_art=&bis=1162145698.29444&zeitvon=&zeitbis=&cookies=HASH(0xab04d94)&ind_volume=ON&boerse_id=5&von=0&banner_ref=HASH(0xafc5600)&req_host=www.ariva.de&b=0&ind_gd38=ON)
Jetzt anmelden und diskutieren
Registrieren
Login
Zum Thread wechseln Häufig gestellte Fragen zur Norfolk Southern Aktie und zum Norfolk Southern Kurs
Der aktuelle Kurs der Norfolk Southern Aktie liegt bei 246,00 €.
Für 1.000€ kann man sich 4,07 Norfolk Southern Aktien kaufen.
Das Tickersymbol der Norfolk Southern Aktie lautet NSC.
Die 1 Monats-Performance der Norfolk Southern Aktie beträgt aktuell -1,20%.
Der Aktienkurs der Norfolk Southern Aktie liegt aktuell bei 246,00 EUR. In den letzten 30 Tagen hat die Aktie eine Performance von -1,20% erzielt.
Auf 3 Monate gesehen weist die Aktie von Norfolk Southern eine Wertentwicklung von 0,41% aus und über 6 Monate sind es 0,41%.
Auf 3 Monate gesehen weist die Aktie von Norfolk Southern eine Wertentwicklung von 0,41% aus und über 6 Monate sind es 0,41%.
Das 52-Wochen-Hoch der Norfolk Southern Aktie liegt bei 263,00 €.
Das 52-Wochen-Tief der Norfolk Southern Aktie liegt bei 181,50 €.
Das Allzeithoch von Norfolk Southern liegt bei 267,45 €.
Das Allzeittief von Norfolk Southern liegt bei 29,42 €.
Die Volatilität der Norfolk Southern Aktie liegt derzeit bei 33,16%. Diese Kennzahl zeigt, wie stark der Kurs von Norfolk Southern in letzter Zeit schwankte.
Die Marktkapitalisierung beträgt 55,92 Mrd. €
Insgesamt sind 226,5 Mio Norfolk Southern Aktien im Umlauf.
Interval Partners, LP hält +0,35% der Aktien und ist damit Hauptaktionär.
Laut money:care Nachhaltigkeitsscore liegt die Nachhaltigkeit von Norfolk Southern bei 52%. Erfahre hier mehr
Norfolk Southern hat seinen Hauptsitz in USA.
Norfolk Southern gehört zum Sektor Straßen- u. Schienenverkehr.
Das KGV der Norfolk Southern Aktie beträgt 23,96.
Der Jahresumsatz des Geschäftsjahres 2024 von Norfolk Southern betrug 12,12 Mrd $.
Die nächsten Termine von Norfolk Southern sind:
- 31.03.2026 - Quartalsmitteilung
Ja, Norfolk Southern zahlt Dividenden. Zuletzt wurde am 07.11.2025 eine Dividende in Höhe von 1,35 $ (1,17 €) gezahlt.
Zuletzt hat Norfolk Southern am 07.11.2025 eine Dividende in Höhe von 1,35 $ (1,17 €) gezahlt.
Dies entspricht einer Dividendenrendite von 0,46%. Die Dividende wird vierteljährlich gezahlt.
Dies entspricht einer Dividendenrendite von 0,46%. Die Dividende wird vierteljährlich gezahlt.
Die letzte Dividende von Norfolk Southern wurde am 07.11.2025 in Höhe von 1,35 $ (1,17 €) je Aktie ausgeschüttet.
Das ergibt, basierend auf dem aktuellen Kurs, eine Dividendenrendite von 0,46%.
Das ergibt, basierend auf dem aktuellen Kurs, eine Dividendenrendite von 0,46%.
Die Dividende wird vierteljährlich gezahlt.
Der letzte Zahltag der Dividende war am 07.11.2025. Es wurde eine Dividende in Höhe von 1,35 $ (1,17 €) gezahlt.
Um eine Dividende ausgezahlt zu bekommen, muss man die Aktie am Ex-Tag (Ex-Date) im Depot haben.
Die Norfolk Southern Aktie ist in den folgenden 2 großen ETFs enthalten: