
HOUSTON and TUPELO, Miss., Oct. 20, 2025 /PRNewswire/ -- Cadence Bank (NYSE: CADE) (the Company), today announced financial results for the quarter ended September 30, 2025.
Highlights for the third quarter of 2025 included:
"Our third quarter results reflect strong earnings, including PPNR and adjusted earnings per share, as we continue to fire on all cylinders across our Company," remarked Dan Rollins, Chairman and Chief Executive Officer of Cadence Bank. "These results were achieved through steady loan growth, improvement in our net interest margin, continued operating efficiency, and stable credit quality. We are also very pleased to have completed the acquisition of Industry Bancshares, Inc. effective July 1, 2025 as well as the operational integrations of both Industry and First Chatham Bank, and now operate as one bank. These newly merged banks have done an outstanding job retaining and building on customer relationships through the integration process, and we look forward to continuing to grow in these important markets."
Earnings Summary
For the third quarter of 2025, the Company reported net income available to common shareholders of $127.5 million, or $0.67 per diluted common share, compared to $134.1 million, or $0.72 per diluted common share, for the third quarter of 2024 and $129.9 million, or $0.69 per diluted common share, for the second quarter of 2025. Adjusted net income available to common shareholders(1) was $152.8 million, or $0.81 per diluted common share, for the third quarter of 2025, compared with $135.6 million, or $0.73 per diluted common share, for the third quarter of 2024 and $137.5 million, or $0.73 per diluted common share, for the second quarter of 2025.
Return on average assets was 0.95% for the third quarter of 2025, compared to 1.14% for the third quarter of 2024 and 1.09% second quarter of 2025. Adjusted return on average assets(1) was 1.13% for the third quarter of 2025, compared to 1.15% in the third quarter of 2024 and 1.14% in the second quarter of 2025. Additionally, the Company reported adjusted PPNR(1) of $224.1 million, or 1.64% of average assets on an annualized basis, for the third quarter of 2025, which represents an increase of $34.1 million, or 18.0%, compared to the third quarter of 2024 and an increase of $18.1 million, or 8.8% compared to the second quarter of 2025.
Net Interest Revenue
Net interest revenue was $423.7 million for the third quarter of 2025, compared to $361.5 million for the third quarter of 2024 and $378.1 million for the second quarter of 2025. The net interest margin (fully taxable equivalent) was 3.46% for the third quarter of 2025, compared with 3.31% for the third quarter of 2024 and 3.40% for the second quarter of 2025.
Net interest revenue increased $45.6 million, or 12.1%, compared to the second quarter of 2025 due to the Industry transaction, a full quarter's impact of the First Chatham acquisition, and continued improvement in our net interest margin. Purchase accounting loan accretion revenue was $5.5 million for the third quarter of 2025 compared to $2.6 million for the second quarter of 2025. Average earning assets increased to $48.8 billion compared to $44.7 billion for the second quarter of 2025. The linked quarter net interest margin improved by 6 basis points due to improved securities yields, higher loan yields impacted by accretion, and lower funding costs.
Yield on net loans, loans held for sale and leases, excluding accretion, was 6.31% for the third quarter of 2025, which was consistent with the second quarter of 2025. Investment securities yielded 3.65% in the third quarter of 2025, improving from 3.33% for the second quarter of 2025 primarily as a result of the restructuring of the Industry securities portfolio. The average cost of total deposits of 2.25% for the third quarter of 2025 declined by 5 basis points from 2.30% for the second quarter of 2025, driven by declines in the cost of time deposits, and total funding costs of 2.35% for the third quarter of 2025 declined by 7 basis points from 2.42% in the second quarter of 2025.
Balance Sheet Activity
Loans and leases, net of unearned income, increased to $36.8 billion at September 30, 2025 compared to $35.5 billion at June 30, 2025. The increase includes $1.0 billion in loans acquired from Industry and net organic loan growth of $328.4 million, or 3.7% annualized, for the third quarter of 2025. The organic growth was broad-based and included growth in C&I, energy, specialized industries and mortgage, partially offset by paydowns in commercial real estate and asset based lending. Year-to-date, net organic loan growth totaled $1.7 billion, or 6.8% annualized, driven by expansion across our geographic footprint and lending verticals.
Total deposits were $43.9 billion as of September 30, 2025, increasing $3.4 billion from $40.5 billion at the end of the second quarter of 2025. Core customer deposits grew $3.1 billion quarter-over-quarter reflecting the addition of Industry core deposits and stable organic core deposits. Public funds increased $603.0 million due to the addition of Industry deposits, and brokered deposits declined $239.0 million over the same time period. The loan to deposit ratio was 83.8% as of September 30, 2025. Noninterest bearing deposits represented 20.6% of total deposits at the end of the third quarter of 2025 compared to 22.6% at the end of the second quarter of 2025. Borrowed funds declined $750.0 million during the third quarter of 2025 compared to the second quarter of 2025 due primarily to the maturity of FHLB term borrowings utilized to fund the purchase of investment securities in advance of the Industry transaction closing.
Total investment securities increased $0.8 billion from June 30, 2025 to $9.6 billion at September 30, 2025, representing 18.0% of total assets. During the third quarter, the $2.5 billion of securities acquired in the Industry transaction were sold, with the proceeds used for reinvestment back into our securities portfolio at improved yields and duration, and the paydown of brokered deposits and borrowings. Additionally, gains achieved through the execution of these sales supported an additional restructure of approximately $550 million of the Company's existing securities portfolio at a yield improvement of approximately 2.0%. Cash, due from balances and deposits at the Federal Reserve of $1.9 billion at September 30, 2025 increased $0.4 billion compared to $1.5 billion at June 30, 2025.
Goodwill of $1.5 billion increased during the third quarter of 2025 by $127.8 million due to the Industry acquisition.
Credit Results, Provision for Credit Losses and Allowance for Credit Losses
Credit metrics for the third quarter of 2025 reflected overall stability in credit quality. Net charge-offs for the third quarter of 2025 were $23.6 million, or 0.26% of average net loans and leases on an annualized basis, compared with net charge-offs of $22.2 million, or 0.26%, for the third quarter of 2024 and net charge-offs of $21.2 million, or 0.24%, for the second quarter of 2025. The provision for credit losses for the third quarter of 2025 was $32.0 million, compared with $12.0 million for the third quarter of 2024 and $31.0 million for the second quarter of 2025. The provision for credit losses for the third quarter of 2025 included $5.5 million in day-one provision associated with performing loans and leases acquired in the Industry transaction while the second quarter of 2025 included $4.2 million in day-one provision associated with performing loans and leases acquired in the First Chatham transaction. The allowance for credit losses of $496.2 million at September 30, 2025 was 1.35% of total loans and leases compared to 1.38% of total loans and leases at September 30, 2024 and 1.34% of total loans and leases at June 30, 2025.
Total nonperforming assets as a percent of total assets were 0.50% at September 30, 2025 compared to 0.57% at September 30, 2024 and 0.49% at June 30, 2025. Total nonperforming loans and leases as a percentage of loans and leases, net were 0.68% at September 30, 2025 compared to 0.82% at September 30, 2024 and 0.65% at June 30, 2025. Other real estate owned and other repossessed assets was $16.3 million at September 30, 2025 compared to the September 30, 2024 balance of $5.4 million and the June 30, 2025 balance of $15.6 million. Criticized loans represented 2.71% of loans at September 30, 2025 compared to 2.64% at September 30, 2024 and 2.65% at June 30, 2025, while classified loans were 1.89% at September 30, 2025 compared to 2.09% at September 30, 2024 and 2.01% at June 30, 2025.
Noninterest Revenue
Noninterest revenue was $93.5 million for the third quarter of 2025 compared with $85.9 million for the third quarter of 2024 and $98.2 million for the second quarter of 2025. Adjusted noninterest revenue(1) was $93.5 million for the third quarter of 2025 compared with $88.8 million for the third quarter of 2024 and $98.2 million for the second quarter of 2025.
Noninterest revenue declined $4.7 million, or 4.8%, compared to the second quarter of 2025 driven primarily by a decline mortgage banking revenue as well as a decline in other noninterest income. Wealth management revenue was $24.5 million for the third quarter of 2025 down from $25.3 million for the second quarter of 2025 due to approximately $1 million in second quarter seasonal trust tax revenues. Deposit service charge revenue was $19.0 million for the third quarter of 2025, up from $18.1 million for the second quarter of 2025, reflecting additional activity associated with acquired banks. Credit card, debit card and merchant fee revenue was $13.5 million for the third quarter of 2025, up from $13.0 million for the second quarter of 2025.
Mortgage banking revenue totaled $4.5 million for the third quarter of 2025, compared to $1.1 million for the third quarter of 2024 and $8.7 million for the second quarter of 2025. The $4.2 million decline compared to the second quarter of 2025 reflects seasonally lower mortgage production volume and pipeline activity as well as linked quarter reduction in the mortgage servicing rights valuation adjustment.
Other noninterest revenue was $27.7 million for the third quarter of 2025, representing a decline of $5.5 million from $33.1 million for the second quarter of 2025, driven by a $4.3 million loss on the termination of fair value hedges related to the Industry securities portfolio. This loss was offset by the $4.3 million related gain on securities sales, which is shown separately in the income statement. Both the hedging loss and the gain on sale are considered nonroutine in nature. Additionally, other noninterest revenue declined approximately $1.2 million as declines in BOLI and SBA income were partially offset by increases in FHLB dividend income and earnings on limited partnerships.
Noninterest Expense
Noninterest expense for the third quarter of 2025 was $320.2 million, compared with $259.4 million for the third quarter of 2024 and $272.9 million for the second quarter of 2025. Adjusted noninterest expense(1) for the third quarter of 2025 was $293.2 million, compared with $260.4 million for the third quarter of 2024 and $270.4 million for the second quarter of 2025. Adjusted noninterest expense for the third quarter of 2025 excludes $19.8 million of merger expense and $8.2 million of incremental merger related expense while the second quarter of 2025 excludes $2.2 million of merger expense and $0.6 million of incremental merger related expense. The adjusted efficiency ratio(1) improved to 56.5% for the third quarter of 2025, compared to 57.7% for the third quarter of 2024 and 56.7% for the second quarter of 2025.
The $22.8 million, or 8.4%, linked quarter increase in adjusted noninterest expense(1) was driven primarily by increased expenses related to the addition of Industry as well as a full quarter's impact of the First Chatham transaction. Salaries and employee benefits increased $16.1 million compared to the second quarter of 2025, including approximately $1.2 million in incremental merger related expense, $8 million related to the addition of Industry, and an additional $1 million related to the full quarter impact of the First Chatham transaction. Additionally, the Company's annual merit cycle adjustments were effective at the beginning of the third quarter of 2025 and incentive compensation accruals increased linked quarter driven by operating performance. Data processing and software expense increased $5.4 million compared to the second quarter of 2025, $4.7 million of which is incremental merger related expense. Deposit insurance assessments and amortization of intangibles increased $1.5 million and $3.5 million, respectively, linked quarter as a result of the Industry and First Chatham transactions. Other noninterest expense increased $1.4 million compared to the second quarter of 2025 including $2.3 million of incremental merger related expense and a net reduction of $0.9 million in all other expenses.
Capital Management
Total shareholders' equity was $6.1 billion at September 30, 2025, up from $5.6 billion at September 30, 2024 and $5.9 billion at June 30, 2025. Estimated regulatory capital ratios at September 30, 2025 included Common Equity Tier 1 capital of 11.5%, Tier 1 capital of 11.9%, Total risk-based capital of 13.1%, and Tier 1 leverage capital of 9.2%. During the third quarter of 2025, the Company did not repurchase any shares of Company common stock. The Company had 186.3 million outstanding shares of common stock as of September 30, 2025.
Summary
Rollins concluded, "We've achieved a number of key successes over the first three quarters of 2025. Our earnings and operating performance metrics have continued to improve, driven by continued organic balance sheet growth, improved net interest margin and operating efficiency, and stable credit quality. Additionally, the successful completion and operational integration of both the Industry and First Chatham transactions have further enhanced our core deposit base as well as our presence in great markets. As we look forward, we will continue the focus behind these results - taking care of the communities and customers we serve, as we seek to improve shareholder value."
Key Transactions
On May 1, 2025, the Company completed the merger with FCB Financial Corp., the bank holding company for First Chatham Bank (collectively referred to as "First Chatham"), pursuant to which First Chatham was merged with and into the Company. First Chatham was a Savannah, Georgia-based community bank that operated eight branches across the Greater Savannah Area. As of April 30, 2025, First Chatham reported total assets of $604 million, total loans of $387 million, and total deposits of $525 million. Under the terms of the definitive merger agreement, the Company issued approximately 2.3 million shares of common stock plus $23.1 million in cash for all outstanding shares of First Chatham. The purchase accounting for this transaction is considered provisional as management continues to identify and assess information regarding the nature of the acquired assets and liabilities and reviews the associated valuation assumptions and methodologies.
On July 1, 2025, the Company completed the merger with Industry Bancshares, Inc., the bank holding company for Industry State Bank, The First National Bank of Bellville, Fayetteville Bank, Citizens State Bank, The First National Bank of Shiner and Bank of Brenham, (collectively referred to as "Industry"), pursuant to which Industry was merged with and into the Company. Founded in 1911 and headquartered in Industry, Texas, Industry operated 27 full-service branches across Central and Southeast Texas. As of June 30, 2025, Industry reported total assets of $4.1 billion, total loans of $1.0 billion, and total deposits of $4.3 billion. Under the terms of the definitive merger agreement, the Company paid $20.0 million in cash for all outstanding shares of Industry. The purchase accounting for this transaction is considered provisional as management continues to identify and assess information regarding the nature of the acquired assets and liabilities and reviews the associated valuation assumptions and methodologies.
Conference Call and Webcast
The Company will conduct a conference call to discuss its third quarter 2025 financial results on October 21, 2025, at 10:00 a.m. (Central Time). This conference call will be an interactive session between management and analysts. Interested parties may listen to this live conference call via Internet webcast by accessing http://ir.cadencebank.com/events. The webcast will also be available in archived format at the same address.
About Cadence Bank
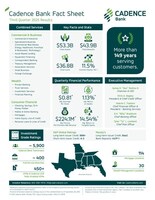
Cadence Bank (NYSE: CADE) is a $53 billion regional bank committed to helping people, companies and communities prosper. With more than 390 locations spanning the South and Texas, Cadence offers comprehensive banking, investment, trust and mortgage products and services to meet the needs of individuals, businesses and corporations. Accolades include being recognized as one of the nation's best employers by Forbes and U.S. News & World Report and a 2025 America's Best Banks by Forbes. Cadence has dutifully served customers for nearly 150 years. Learn more at www.cadencebank.com. Cadence Bank, Member FDIC. Equal Housing Lender.
| (1) Considered a non-GAAP financial measure. A discussion regarding these non-GAAP measures and ratios, including reconciliations of non-GAAP measures to the most directly comparable GAAP measures and definitions for non-GAAP ratios, appears in Table 14 "Reconciliation of Non-GAAP Measures and Other Non-GAAP Ratio Definitions" beginning on page 22 of this news release. |
Forward-Looking Statements
Certain statements made in this news release constitute "forward-looking statements" within the meaning of Section 21E of the Securities Exchange Act of 1934, as amended, and are subject to the safe harbor under the Private Securities Litigation Reform Act of 1995 as well as the "bespeaks caution" doctrine. These statements are often, but not exclusively, made through the use of words or phrases like "assume," "believe," "budget," "contemplate," "continue," "could," "foresee," "indicate," "may," "might," "outlook," "prospect," "potential," "roadmap," "should," "target," "will," "would," the negative versions of such words, or comparable words of a future or forward-looking nature. These forward-looking statements may include, without limitation, discussions regarding general economic, interest rate, trade, real estate market, competitive, employment, and credit market conditions, or any of the Company's comments related to topics in its risk disclosures or results of operations as well as the impact on the Company's financial condition, future net income and earnings per share resulting from the integration of its recently completed acquisitions of First Chatham and Industry, and the Company's ability to deploy capital into strategic and growth initiatives. Forward-looking statements are based upon management's expectations as well as certain assumptions and estimates made by, and information available to, the Company's management at the time such statements were made. Forward-looking statements are not guarantees of future results or performance and are subject to certain known and unknown risks, uncertainties and other factors that are beyond the Company's control and that may cause actual results to differ materially from those expressed in, or implied by, such forward-looking statements.
Risks, uncertainties and other factors the Company may face include, without limitation: general economic, unemployment, trade, credit market and real estate market conditions, including inflation, and the effect of such conditions on customers, potential customers, assets, investments and liquidity; risks arising from market and consumer reactions to the general banking environment, or to conditions or situations at specific banks; reputational risks arising from media coverage of the banking industry and digital misinformation; the risks of changes and continued volatility in interest rates and their effects on the level, cost, and composition of, and competition for, deposits, loan demand and timing of payments, the values of loan collateral, securities, and interest sensitive assets and liabilities; the ability to attract new or retain existing deposits, to retain or grow loans or additional interest and fee income, or to control noninterest expense; the effect of pricing pressures on the Company's net interest margin; the failure of assumptions underlying the establishment of reserves for possible credit losses, fair value for loans and other real estate owned; changes in real estate values; continued uncertainties surrounding the impact of the U.S.'s tariffs, including potential negative impact to our loan portfolio, our customers' businesses and overall profitability, potential for increases in problem loans, potential re-evaluation of credit marks and interest rates, and lower equity valuation and potential slowdown in capital markets; uncertain duration of trade conflicts; a deterioration of the credit rating for U.S. long-term sovereign debt, actions that the U.S. government may take to avoid exceeding the debt ceiling, or uncertainties surrounding the debt ceiling and the federal budget; uncertainties surrounding the functionality of the federal government; potential delays or other problems in implementing and executing the Company's growth, expansion, acquisition, or divestment strategies, including delays in obtaining regulatory or other necessary approvals, or the failure to realize any anticipated benefits or synergies from any acquisitions, growth, or divestment strategies; the ability to pay dividends on the Company's 5.5% Series A Non-Cumulative Perpetual Preferred Stock, par value $0.01 per share; possible downgrades in the Company's credit ratings or outlook which could increase the costs or availability of funding from capital markets; changes in legal, financial, accounting, and/or regulatory requirements; the costs and expenses to comply with such changes; the enforcement efforts of federal and state bank regulators; the ability to keep pace with technological changes, including changes regarding maintaining cybersecurity and the impact of generative artificial intelligence; increased competition in the financial services industry, particularly from regional and national institutions; the impact of a failure in, or breach of, the Company's operational or security systems or infrastructure, or those of third parties with whom the Company does business, including as a result of cyber-attacks or an increase in the incidence or severity of fraud, illegal payments, security breaches or other illegal acts impacting the Company or the Company's customers. The Company also faces risks from natural disasters or acts of war or terrorism; international or political instability, including the impacts related to or resulting from the U.S.'s tariffs and international trade conflicts, Russia's military action in Ukraine, the durability of efforts at peace in the Middle East, and additional sanctions and export controls, as well as the broader impacts to financial markets and the global macroeconomic and geopolitical environments.
The Company also faces risks from: possible adverse rulings, judgments, settlements or other outcomes of pending, ongoing and future litigation, as well as governmental, administrative and investigatory matters; the impairment of the Company's goodwill or other intangible assets; losses of key employees and personnel; the diversion of management's attention from ongoing business operations and opportunities; and the Company's success in executing its business plans and strategies, and managing the risks involved in all of the foregoing.
The foregoing factors should not be construed as exhaustive and should be read in conjunction with those factors that are set forth from time to time in the Company's periodic and current reports filed with its primary federal regulator, including those factors included in the Company's Annual Report on Form 10-K for the year ended December 31, 2024, particularly those under the heading "Item 1A. Risk Factors," in the Company's Quarterly Reports on Form 10-Q under the heading "Part II-Item 1A. Risk Factors," and in the Company's Current Reports on Form 8-K.
Although the Company believes that the expectations reflected in these forward-looking statements are reasonable as of the date of this news release, if one or more events related to these or other risks or uncertainties materialize, or if the Company's underlying assumptions prove to be incorrect, actual results may prove to be materially different from the results expressed or implied by the forward-looking statements. Accordingly, undue reliance should not be placed on any forward-looking statements. The forward-looking statements speak only as of the date of this news release, and the Company does not undertake any obligation to publicly update or review any forward-looking statement, except as required by applicable law. All written or oral forward-looking statements attributable to the Company are expressly qualified in their entirety by this section.
| Table 1 Selected Financial Data
| ||||||||
| | Quarter Ended | | Year-to-date | |||||
| (In thousands) | Sep 2025 | Jun 2025 | Mar 2025 | Dec 2024 | Sep 2024 | | Sep 2025 | Sep 2024 |
| Earnings Summary: | | | | | | | | |
| Interest revenue | $ 704,643 | $ 635,599 | $ 599,257 | $ 620,321 | $ 647,713 | | $ 1,939,499 | $ 1,927,036 |
| Interest expense | 280,916 | 257,459 | 236,105 | 255,790 | 286,255 | | 774,480 | 855,352 |
| Net interest revenue | 423,727 | 378,140 | 363,152 | 364,531 | 361,458 | | 1,165,019 | 1,071,684 |
| Provision for credit losses | 32,000 | 31,000 | 20,000 | 15,000 | 12,000 | | 83,000 | 56,000 |
| Net interest revenue, after provision for credit losses | 391,727 | 347,140 | 343,152 | 349,531 | 349,458 | | 1,082,019 | 1,015,684 |
| Noninterest revenue | 93,478 | 98,181 | 85,387 | 86,165 | 85,901 | | 277,046 | 270,345 |
| Noninterest expense | 320,246 | 272,863 | 259,349 | 266,186 | 259,438 | | 852,458 | 779,343 |
| Income before income taxes | 164,959 | 172,458 | 169,190 | 169,510 | 175,921 | | 506,607 | 506,686 |
| Income tax expense | 35,110 | 37,813 | 35,968 | 36,795 | 39,482 | | 108,891 | 115,797 |
| Net income | 129,849 | 134,645 | 133,222 | 132,715 | 136,439 | | 397,716 | 390,889 |
| Less: Preferred dividends | 2,372 | 4,744 | 2,372 | 2,372 | 2,372 | | 9,488 | 7,116 |
| Net income available to common shareholders | $ 127,477 | $ 129,901 | $ 130,850 | $ 130,343 | $ 134,067 | | $ 388,228 | $ 383,773 |
| | | | | | | | | |
| Balance Sheet - Period End Balances | | | | | | | | |
| Total assets | $ 53,282,352 | $ 50,378,840 | $ 47,743,294 | $ 47,019,190 | $ 49,204,933 | | $ 53,282,352 | $ 49,204,933 |
| Total earning assets | 47,729,237 | 45,400,518 | 43,172,997 | 42,386,627 | 44,834,897 | | 47,729,237 | 44,834,897 |
| Available for sale securities | 9,616,389 | 8,837,400 | 7,912,159 | 7,293,988 | 7,841,685 | | 9,616,389 | 7,841,685 |
| Loans and leases, net of unearned income | 36,801,836 | 35,465,181 | 34,051,610 | 33,741,755 | 33,303,972 | | 36,801,836 | 33,303,972 |
| Allowance for credit losses (ACL) | 496,199 | 474,651 | 457,791 | 460,793 | 460,859 | | 496,199 | 460,859 |
| Net book value of acquired loans | 5,512,749 | 4,594,171 | 4,365,789 | 4,783,206 | 5,521,000 | | 5,512,749 | 5,521,000 |
| Unamortized net discount on acquired loans | 41,906 | 19,414 | 13,060 | 15,611 | 17,988 | | 41,906 | 17,988 |
| Total deposits | 43,921,456 | 40,493,518 | 40,335,728 | 40,496,201 | 38,844,360 | | 43,921,456 | 38,844,360 |
| Total deposits and repurchase agreements | 43,950,988 | 40,514,743 | 40,355,399 | 40,519,817 | 38,861,324 | | 43,950,988 | 38,861,324 |
| Other short-term borrowings | 925,000 | 1,575,000 | 235,000 | — | 3,500,000 | | 925,000 | 3,500,000 |
| Subordinated and long-term borrowings | 1,330,657 | 1,430,674 | 560,690 | 10,706 | 225,823 | | 1,330,657 | 225,823 |
| Total shareholders' equity | 6,083,096 | 5,916,283 | 5,718,541 | 5,569,683 | 5,572,863 | | 6,083,096 | 5,572,863 |
| Total shareholders' equity, excluding AOCI (1) | 6,576,878 | 6,492,440 | 6,339,744 | 6,264,178 | 6,163,205 | | 6,576,878 | 6,163,205 |
| Common shareholders' equity | 5,916,103 | 5,749,290 | 5,551,548 | 5,402,690 | 5,405,870 | | 5,916,103 | 5,405,870 |
| Common shareholders' equity, excluding AOCI (1) | $ 6,409,885 | $ 6,325,447 | $ 6,172,751 | $ 6,097,185 | $ 5,996,212 | | $ 6,409,885 | $ 5,996,212 |
| | | | | | | | | |
| Balance Sheet - Average Balances | | | | | | | | |
| Total assets | $ 54,352,974 | $ 49,356,696 | $ 47,135,431 | $ 47,263,538 | $ 47,803,977 | | $ 50,308,138 | $ 48,211,586 |
| Total earning assets | 48,807,542 | 44,741,277 | 42,637,002 | 42,920,125 | 43,540,045 | | 45,417,877 | 43,871,434 |
| Available for sale securities | 10,171,253 | 8,814,463 | 7,302,172 | 7,636,683 | 7,915,636 | | 8,773,139 | 8,072,391 |
| Loans and leases, net of unearned income | 36,623,037 | 34,762,808 | 33,944,416 | 33,461,931 | 33,279,819 | | 35,119,899 | 32,988,706 |
| Total deposits | 44,859,162 | 39,897,600 | 40,353,292 | 39,743,224 | 37,634,453 | | 41,719,856 | 38,050,413 |
| Total deposits and repurchase agreements | 44,883,355 | 39,916,099 | 40,376,248 | 39,761,277 | 37,666,828 | | 41,741,743 | 38,152,672 |
| Other short-term borrowings | 1,122,185 | 1,419,615 | 108,389 | 905,815 | 3,512,218 | | 887,110 | 3,504,102 |
| Subordinated and long-term borrowings | 1,429,577 | 1,338,059 | 129,030 | 123,442 | 265,790 | | 970,319 | 367,826 |
| Total shareholders' equity | 5,982,117 | 5,827,081 | 5,651,592 | 5,589,361 | 5,420,826 | | 5,821,474 | 5,274,579 |
| Common shareholders' equity | $ 5,815,124 | $ 5,660,088 | $ 5,484,599 | $ 5,422,368 | $ 5,253,833 | | $ 5,654,481 | $ 5,107,586 |
| | | | | | | | | |
| Nonperforming Assets: | | | | | | | | |
| Nonperforming loans and leases (NPL) (2) (3) | 249,822 | 231,243 | 235,952 | 264,692 | 272,954 | | 249,822 | 272,954 |
| Other real estate owned and other assets | 16,250 | 15,599 | 8,452 | 5,754 | 5,354 | | 16,250 | 5,354 |
| Nonperforming assets (NPA) | $ 266,072 | $ 246,842 | $ 244,404 | $ 270,446 | $ 278,308 | | $ 266,072 | $ 278,308 |
| | |
| (1) | Denotes non-GAAP financial measure. Refer to related disclosure and reconciliation on pages 23 - 27. |
| (2) | At September 30, 2025, $45.4 million of NPL is covered by government guarantees from the SBA, FHA, VA or USDA. Refer to Table 7 on page 13 for related information. |
| (3) | At September 30, 2025, NPL does not include nonperforming loans held for sale of $0.3 million. |
| Table 2 Selected Financial Ratios
| ||||||||
| | Quarter Ended | | Year-to-date | |||||
| | Sep 2025 | Jun 2025 | Mar 2025 | Dec 2024 | Sep 2024 | | Sep 2025 | Sep 2024 |
| Financial Ratios and Other Data: | | | | | | | | |
| Return on average assets (2) | 0.95 % | 1.09 % | 1.15 % | 1.12 % | 1.14 % | | 1.06 | 1.08 |
| Adjusted return on average assets (1)(2) | 1.13 | 1.14 | 1.15 | 1.11 | 1.15 | | 1.14 | 1.07 |
| Return on average common shareholders' equity (2) | 8.70 | 9.21 | 9.68 | 9.56 | 10.15 | | 9.18 | 10.04 |
| Adjusted return on average common shareholders' equity (1)(2) | 10.43 | 9.74 | 9.72 | 9.53 | 10.27 | | 9.97 | 9.88 |
| Return on average tangible common equity (1)(2) | 12.13 | 12.41 | 13.15 | 13.06 | 14.04 | | 12.55 | 14.06 |
| Adjusted return on average tangible common equity (1)(2) | 14.54 | 13.13 | 13.20 | 13.02 | 14.21 | | 13.63 | 13.84 |
| Pre-tax pre-provision net revenue to total average assets (1)(2) | 1.44 | 1.65 | 1.63 | 1.55 | 1.56 | | 1.57 | 1.56 |
| Adjusted pre-tax pre-provision net revenue to total average assets (1)(2) | 1.64 | 1.67 | 1.63 | 1.55 | 1.58 | | 1.65 | 1.54 |
| Net interest margin-fully taxable equivalent | 3.46 | 3.40 | 3.46 | 3.38 | 3.31 | | 3.44 | 3.27 |
| Net interest rate spread-fully taxable equivalent | 2.76 | 2.68 | 2.74 | 2.59 | 2.45 | | 2.73 | 2.43 |
| Efficiency ratio fully tax equivalent (1) | 61.67 | 57.21 | 57.74 | 58.98 | 57.90 | | 58.98 | 57.99 |
| Adjusted efficiency ratio fully tax equivalent (1) | 56.46 | 56.69 | 57.58 | 59.09 | 57.73 | | 56.88 | 58.18 |
| Loan/deposit ratio | 83.79 % | 87.58 % | 84.42 % | 83.32 % | 85.74 % | | 83.79 % | 85.74 % |
| Full time equivalent employees | 5,825 | 5,514 | 5,356 | 5,335 | 5,327 | | 5,825 | 5,327 |
| | | | | | | | | |
| Credit Quality Ratios: | | | | | | | | |
| Net charge-offs to average loans and leases (2) | 0.26 % | 0.24 % | 0.27 % | 0.17 % | 0.26 % | | 0.26 % | 0.26 % |
| Provision for credit losses to average loans and leases (2) | 0.35 | 0.36 | 0.24 | 0.18 | 0.14 | | 0.32 | 0.23 |
| ACL to loans and leases, net | 1.35 | 1.34 | 1.34 | 1.37 | 1.38 | | 1.35 | 1.38 |
| ACL to NPL | 198.62 | 205.26 | 194.02 | 174.09 | 168.84 | | 198.62 | 168.84 |
| NPL to loans and leases, net | 0.68 | 0.65 | 0.69 | 0.78 | 0.82 | | 0.68 | 0.82 |
| NPA to total assets | 0.50 | 0.49 | 0.51 | 0.58 | 0.57 | | 0.50 | 0.57 |
| | | | | | | | | |
| Equity Ratios: | | | | | | | | |
| Total shareholders' equity to total assets | 11.42 % | 11.74 % | 11.98 % | 11.85 % | 11.33 % | | 11.42 % | 11.33 % |
| Total common shareholders' equity to total assets | 11.10 | 11.41 | 11.63 | 11.49 | 10.99 | | 11.10 | 10.99 |
| Tangible common shareholders' equity to tangible assets (1) | 8.24 | 8.74 | 8.87 | 8.67 | 8.28 | | 8.24 | 8.28 |
| Tangible common shareholders' equity, excluding AOCI, to tangible assets, excluding AOCI (1) | 9.11 | 9.80 | 10.07 | 10.04 | 9.40 | | 9.11 | 9.40 |
| | | | | | | | | |
| Capital Adequacy (3): | | | | | | | | |
| Common Equity Tier 1 capital | 11.5 % | 12.2 % | 12.4 % | 12.4 % | 12.3 % | | 11.5 % | 12.3 % |
| Tier 1 capital | 11.9 | 12.6 | 12.9 | 12.8 | 12.7 | | 11.9 | 12.7 |
| Total capital | 13.1 | 13.8 | 14.1 | 14.0 | 14.5 | | 13.1 | 14.5 |
| Tier 1 leverage capital | 9.2 | 10.3 | 10.6 | 10.4 | 10.1 | | 9.2 | 10.1 |
| |
| (1) Denotes non-GAAP financial measure. Refer to related disclosure and reconciliation on pages 23 - 27. |
| (2) Annualized. |
| (3) Current quarter regulatory capital ratios are estimated. |
| Table 3 Selected Financial Information
| ||||||||
| | Quarter Ended | | Year-to-date | |||||
| | Sep 2025 | Jun 2025 | Mar 2025 | Dec 2024 | Sep 2024 | | Sep 2025 | Sep 2024 |
| Common Share Data: | | | | | | | | |
| Diluted earnings per share | $ 0.67 | $ 0.69 | $ 0.70 | $ 0.70 | $ 0.72 | | $ 2.07 | $ 2.07 |
| Adjusted earnings per share (1) | 0.81 | 0.73 | 0.71 | 0.70 | 0.73 | | 2.25 | 2.04 |
| Cash dividends per share | 0.275 | 0.275 | 0.275 | 0.250 | 0.250 | | 0.825 | 0.75 |
| Book value per share | 31.75 | 30.86 | 30.16 | 29.44 | 29.65 | | 31.75 | 29.65 |
| Tangible book value per share (1) | 22.82 | 22.94 | 22.30 | 21.54 | 21.68 | | 22.82 | 21.68 |
| Market value per share (last) | 37.54 | 31.98 | 30.36 | 34.45 | 31.85 | | 37.54 | 31.85 |
| Market value per share (high) | 38.47 | 32.68 | 36.53 | 40.20 | 34.13 | | 38.47 | 34.13 |
| Market value per share (low) | 31.76 | 25.22 | 28.90 | 30.21 | 27.46 | | 25.22 | 24.99 |
| Market value per share (average) | 36.04 | 29.97 | 33.13 | 35.17 | 30.96 | | 33.08 | 28.98 |
| Dividend payout ratio | 41.04 % | 39.86 % | 39.29 % | 35.71 % | 34.72 % | | 39.86 % | 36.23 % |
| Adjusted dividend payout ratio (1) | 33.95 % | 37.67 % | 38.73 % | 35.71 % | 34.25 % | | 36.67 % | 36.76 % |
| Total shares outstanding | 186,307,016 | 186,307,016 | 184,046,420 | 183,527,575 | 182,315,142 | | 186,307,016 | 182,315,142 |
| Average shares outstanding - diluted | 189,053,254 | 187,642,873 | 186,121,979 | 186,038,243 | 185,496,110 | | 187,616,202 | 185,443,201 |
| | | | | | | | | |
| Yield/Rate: | | | | | | | | |
| (Taxable equivalent basis) | | | | | | | | |
| Loans, loans held for sale, and leases | 6.37 % | 6.34 % | 6.33 % | 6.42 % | 6.64 % | | 6.35 % | 6.58 % |
| Loans, loans held for sale, and leases excluding net accretion on acquired loans | 6.31 | 6.31 | 6.30 | 6.40 | 6.61 | | 6.31 | 6.54 |
| Available for sale securities: | | | | | | | | |
| Taxable | 3.54 | 3.32 | 2.99 | 3.03 | 3.03 | | 3.31 | 3.11 |
| Tax-exempt | 5.68 | 4.14 | 4.04 | 3.93 | 3.97 | | 5.32 | 4.11 |
| Other investments | 4.78 | 4.41 | 4.42 | 4.77 | 5.37 | | 4.58 | 5.44 |
| Total interest earning assets and revenue | 5.74 | 5.70 | 5.71 | 5.76 | 5.92 | | 5.72 | 5.87 |
| Deposits | 2.25 | 2.30 | 2.35 | 2.44 | 2.55 | | 2.29 | 2.51 |
| Interest bearing demand and money market | 2.66 | 2.69 | 2.69 | 2.87 | 3.13 | | 2.68 | 3.13 |
| Savings | 0.68 | 0.57 | 0.57 | 0.57 | 0.57 | | 0.61 | 0.57 |
| Time | 3.92 | 3.98 | 4.10 | 4.28 | 4.50 | | 3.99 | 4.48 |
| Total interest bearing deposits | 2.90 | 2.92 | 2.96 | 3.12 | 3.30 | | 2.92 | 3.26 |
| Fed funds purchased, securities sold under agreement to repurchase and other | 4.48 | 4.45 | 4.45 | 4.58 | 5.10 | | 4.45 | 4.81 |
| Short-term FHLB borrowings | 4.36 | 4.31 | 4.43 | — | — | | 4.33 | — |
| Short-term BTFP borrowings | — | — | — | 4.77 | 4.77 | | — | 4.79 |
| Total interest bearing deposits and short-term borrowings | 2.94 | 2.98 | 2.96 | 3.16 | 3.46 | | 2.96 | 3.43 |
| Subordinated and long-term borrowings | 3.91 | 4.07 | 4.05 | 4.14 | 4.30 | | 3.99 | 4.36 |
| Total interest bearing liabilities | 2.98 | 3.02 | 2.97 | 3.17 | 3.47 | | 2.99 | 3.44 |
| Interest bearing liabilities to interest earning assets | 76.62 % | 76.39 % | 75.70 % | 74.82 % | 75.40 % | | 76.26 % | 75.70 % |
| Net interest income tax equivalent adjustment (in thousands) | $ 2,068 | $ 637 | $ 630 | $ 648 | $ 694 | | $ 3,335 | $ 1,974 |
| |
| (1) Denotes non-GAAP financial measure. Refer to related disclosure and reconciliation on pages 23 - 27. |
| Table 4 Consolidated Balance Sheets (Unaudited)
| |||||
| | As of | ||||
| (In thousands) | Sep 2025 | Jun 2025 | Mar 2025 | Dec 2024 | Sep 2024 |
| ASSETS | | | | | |
| Cash and due from banks | $ 839,841 | $ 710,679 | $ 578,513 | $ 624,884 | $ 504,827 |
| Interest bearing deposits with other banks and Federal funds sold | 1,049,332 | 825,878 | 988,787 | 1,106,692 | 3,483,299 |
| Available for sale securities, at fair value | 9,616,389 | 8,837,400 | 7,912,159 | 7,293,988 | 7,841,685 |
| Loans and leases, net of unearned income | 36,801,836 | 35,465,181 | 34,051,610 | 33,741,755 | 33,303,972 |
| Allowance for credit losses | 496,199 | 474,651 | 457,791 | 460,793 | 460,859 |
| Net loans and leases | 36,305,637 | 34,990,530 | 33,593,819 | 33,280,962 | 32,843,113 |
| Loans held for sale, at fair value | 261,680 | 272,059 | 220,441 | 244,192 | 205,941 |
| Premises and equipment, net | 855,275 | 806,879 | 780,963 | 783,456 | 797,556 |
| Goodwill | 1,515,771 | 1,387,990 | 1,366,923 | 1,366,923 | 1,366,923 |
| Other intangible assets, net | 149,039 | 87,814 | 79,522 | 83,190 | 87,094 |
| Bank-owned life insurance | 768,887 | 671,813 | 654,964 | 651,838 | 652,057 |
| Other assets | 1,920,501 | 1,787,798 | 1,567,203 | 1,583,065 | 1,422,438 |
| Total Assets | $ 53,282,352 | $ 50,378,840 | $ 47,743,294 | $ 47,019,190 | $ 49,204,933 |
| LIABILITIES Für dich aus unserer Redaktion zusammengestelltHinweis: ARIVA.DE veröffentlicht in dieser Rubrik Analysen, Kolumnen und Nachrichten aus verschiedenen Quellen. Die ARIVA.DE AG ist nicht verantwortlich für Inhalte, die erkennbar von Dritten in den „News“-Bereich dieser Webseite eingestellt worden sind, und macht sich diese nicht zu Eigen. Diese Inhalte sind insbesondere durch eine entsprechende „von“-Kennzeichnung unterhalb der Artikelüberschrift und/oder durch den Link „Um den vollständigen Artikel zu lesen, klicken Sie bitte hier.“ erkennbar; verantwortlich für diese Inhalte ist allein der genannte Dritte. Weitere Artikel des AutorsThemen im Trend | |||||


