 Aufrufe: 93
This press release features multimedia. View the full release here: https://www.businesswire.com/news/home/20260211688662/en/
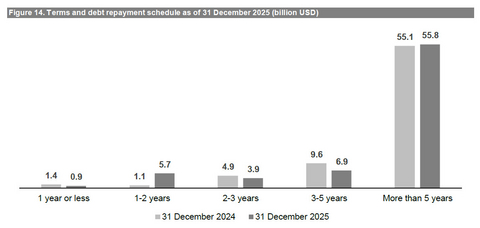
Figure 14. Terms and debt repayment schedule as of 31 December 2025 (billion USD)
Regulated and inside information1
“Beer plays an important role in bringing people together and creating moments of celebration. In 2025, we executed our strategy, made disciplined capital allocation choices and delivered growth within our outlook for the year, even as we navigated a dynamic consumer environment. We exit 2025 with improved momentum and enter 2026 well positioned to engage consumers with our megabrands and an unparalleled lineup of mega platforms. Thank you to our colleagues for their ongoing commitment, hard work and passion for our business.” – Michel Doukeris, CEO, AB InBev
| Revenue 4Q +2.5% | FY +2.0% Revenue increased by 2.5% in 4Q25 with revenue per hl growth of 4.0% and by 2.0% in FY25 with revenue per hl growth of 4.4%.
Reported revenue increased by 4.8% in 4Q25 to 15 555 million USD and decreased by 0.8% in FY25 to 59 320 million USD, impacted by unfavorable currency translation.
Volumes 4Q -1.5% | FY -2.3% Volumes declined by 1.5% in 4Q25, with beer volumes down by 1.9% and non-beer volumes up by 0.6%.
Volumes declined by 2.3% in FY25, with beer volumes down by 2.6% and non-beer volumes down by 0.4%.
Normalized EBITDA 4Q +2.3% | FY +4.9% Normalized EBITDA increased by 2.3% to 5 473 million USD in 4Q25, with a margin contraction of 10bps to 35.2%.
Normalized EBITDA increased by 4.9% to 21 223 million USD in FY25, with a margin expansion of 101 bps to 35.8%.
| Underlying Profit 4Q 1 884 | FY 7 410 million USD Underlying Profit was 1 884 million USD in 4Q25 compared to 1 770 million USD in 4Q24 and was 7 410 million USD in FY25 compared to 7 061 million USD in FY24.
Reported profit attributable to equity holders of AB InBev was 1 959 million USD in 4Q25 compared to 1 220 million USD in 4Q24 and was 6 837 million USD in FY25 compared to 5 855 million USD in FY24.
Underlying EPS 4Q 0.95 | FY 3.73 USD Underlying EPS increased by 7.5% to 0.95 USD in 4Q25, compared to 0.88 USD in 4Q24, and increased by 6.0% to 3.73 USD in FY25, compared to 3.53 USD in FY24.
On a constant currency basis, Underlying EPS increased by 2.1% in 4Q25 and by 9.4% in FY25.
Net Debt to EBITDA 2.87x Net debt to normalized EBITDA ratio was 2.87x at 31 December 2025, compared to 2.89x at 31 December 2024. |
| Capital Allocation Dividend 1.00 EUR The AB InBev Board of Directors proposes a final dividend of 1.00 EUR per share, subject to shareholder approval at the AGM on 29 April 2026. Combined with the interim dividend of 0.15 EUR per share paid in November 2025, the full year 2025 dividend would be 1.15 EUR per share. A timeline showing the ex-dividend, record and payment dates can be found on page 16.
As of 9 February 2026, we have completed approximately 635 million USD of the 6 billion USD share buyback program announced on 30 October 2025. | |
The 2025 Full Year Financial Report is available on our website at www.ab-inbev.com.
| 1The enclosed information constitutes inside information as defined in Regulation (EU) No 596/2014 of the European Parliament and of the Council of 16 April 2014 on market abuse, and regulated information as defined in the Belgian Royal Decree of 14 November 2007 regarding the duties of issuers of financial instruments which have been admitted for trading on a regulated market. For important disclaimers and notes on the basis of preparation, please refer to page 18. |
Management comments
Continued earnings growth, margin expansion and solid free cash flow generation
In 2025, we continued to execute our strategy with discipline, delivering consistent financial performance while further strengthening the fundamentals of our business. Our teams remained focused on building great brands, operating efficiently and increasing our capital allocation flexibility. Momentum improved across many of our key markets in 4Q25 and we enter 2026 well positioned to engage consumers and accelerate growth.
Beer is a vibrant and resilient category, deeply connected to consumers across social occasions and embedded in culture. While near-term demand in some key markets was impacted by a constrained consumer environment and unseasonable weather, the long-term fundamentals and growth potential of the category remain unchanged. Our brands are iconic, our geographic footprint is advantaged, and our execution capabilities continue to strengthen.
The fundamentals of our business underpinned another year of solid financial performance. Revenue increased by 2.0%, with growth in 65% of our markets. Underlying EPS increased by 6.0% in USD and 9.4% in constant currency, and we maintained our solid free cash flow generation, delivering 11.3 billion USD. Disciplined revenue management and premiumization drove a revenue per hl increase of 4.4% and efficient overhead management supported an EBITDA margin expansion of 101bps.
Our ability to deliver consistent results across varying operating conditions is a testament to the durability of our strategy and the resilience of our business.
Progressing our strategic priorities
Delivering reliable compounding growth
A central objective of our strategy is to deliver reliable compounding growth over time. While each year will have unique dynamics, our focus remains on consistent progress across the 3 pillars of our strategy to drive long-term value creation.
Since FY21, we have increased our revenue by 5 billion USD, EBITDA by 2 billion USD and free cash flow by 2 billion USD. Our Underlying EPS has increased by a CAGR of 6.7% in USD. Our financial performance has been consistent, with organic EBITDA growth within or above our medium-term growth outlook in every year. We have been disciplined in our capital allocation choices, reducing net debt by 15.3 billion USD to reach 2.87x net debt to EBITDA, progressively increased our dividend each year, including the payment of an interim dividend in 2025, completed 3.2 billion USD of share buybacks, and are currently executing a further 6 billion USD program.
The consistency of our financial performance is a reflection of our deliberate choices, clear strategic priorities and the unwavering commitment of our people to best-in-class execution.
Looking forward
We remain confident in the long-term potential of the beer category, which has structural tailwinds for growth and plays an important role in bringing people together and creating moments of celebration. The progress we have made in executing our strategy has driven consistent financial performance, increased our capital allocation flexibility and enabled increased returns to our shareholders while continuing to deleverage. We enter 2026 in a position of strength, with a highly engaged team, improved momentum across many of our key markets and with an unparalleled portfolio and lineup of mega platforms. From the Super Bowl to the Winter Olympics to the FIFA World Cup to our partnership with Netflix and, as from 2027, our sponsorship of the UEFA Men's Club Competitions, including the UEFA Champions League, we are uniquely positioned to engage consumers and activate the category. In closing, we would like to thank our colleagues around the world for their hard work, commitment, and passion, which continue to underpin our progress and performance.
2026 Outlook
(i) Overall Performance: We expect our EBITDA to grow in line with our medium-term outlook of between 4-8%. The outlook for FY26 reflects our current assessment of inflation and other macroeconomic conditions.
(ii) Net Finance Costs: Net pension interest expenses and accretion expenses are expected to be in the range of 190 to 220 million USD per quarter, depending on currency and interest rate fluctuations. We expect the average gross debt coupon in FY26 to be approximately 4%.
(iii) Effective Tax Rate (ETR): We expect the normalized ETR in FY26 to be in the range of 26% to 28%. The ETR outlook does not consider the impact of potential future changes in legislation.
(iv) Net Capital Expenditure: We expect net capital expenditure of between 3.5 and 4.0 billion USD in FY26.
| Figure 1. Consolidated performance | |||||||||
| in USD Mio, except EPS in USD per share and Volumes in thousand hls | 4Q24 | 4Q25 | Organic | ||||||
| growth | |||||||||
| Volumes | 141 829 |
| 139 166 |
| (1.5 | )% | |||
| Beer | 121 052 |
| 119 039 |
| (1.9 | ||||
| Non-Beer | 20 777 |
| 20 127 |
| 0.6 | ||||
| Revenue | 14 841 |
| 15 555 |
| 2.5 | % | |||
| Gross profit | 8 197 |
| 8 613 |
| 2.5 | % | |||
| Gross margin | 55.2 | 55.4 | (1)bps | ||||||
| Normalized EBITDA | 5 245 |
| 5 473 |
| 2.3 | % | |||
| Normalized EBITDA margin | 35.3 | 35.2 | (10)bps | ||||||
| Normalized EBIT | 3 824 |
| 4 049 |
| 4.5 | % | |||
| Normalized EBIT margin | 25.8 | 26.0 | 49bps | ||||||
|
| |||||||||
| Profit attributable to equity holders of AB InBev | 1 220 |
| 1 959 |
| |||||
| Underlying Profit | 1 770 |
| 1 884 |
| |||||
|
| |||||||||
| Basic EPS | 0.61 |
| 0.99 |
| |||||
| Underlying EPS | 0.88 |
| 0.95 |
|
| ||||
| FY24 | FY25 | Organic | |||||||
| growth | |||||||||
| Volumes | 575 706 |
| 561 100 |
| (2.3 | )% | |||
| Beer | 496 354 |
| 484 187 |
| (2.6 | ||||
| Non-Beer | 79 352 |
| 76 914 |
| (0.4 | ||||
| Revenue | 59 768 |
| 59 320 |
| 2.0 | % | |||
| Gross profit | 33 024 |
| 33 179 |
| 3.4 | % | |||
| Gross margin | 55.3 | 55.9 | 78bps | ||||||
| Normalized EBITDA | 20 958 |
| 21 223 |
| 4.9 | % | |||
| Normalized EBITDA margin | 35.1 | 35.8 | 101bps | ||||||
| Normalized EBIT | 15 462 |
| 15 854 |
| 7.0 | % | |||
| Normalized EBIT margin | 25.9 | 26.7 | 126bps | ||||||
|
| |||||||||
| Profit attributable to equity holders of AB InBev | 5 855 |
| 6 837 |
| |||||
| Underlying Profit | 7 061 |
| 7 410 |
| |||||
|
| |||||||||
| Basic EPS | 2.92 |
| 3.45 |
| |||||
| Underlying EPS | 3.53 |
| 3.73 |
|
| ||||
| Figure 2. Volumes | ||||||||||||||||
| in thousand hls | 4Q24 | Scope | Organic growth | 4Q25 | Organic growth | |||||||||||
| Total | Beer | |||||||||||||||
| North America | 19 516 | (216 | (681 | 18 619 | (3.5 | (5.5 | ||||||||||
| Middle Americas | 38 907 | (300 | 1 065 |
| 39 672 | 2.8 | 2.0 | |||||||||
| South America | 44 950 |
| (1 791 | 43 160 | (4.0 | (3.7 | ||||||||||
| EMEA | 24 883 | (15 | (619 | 24 249 | (2.5 | (2.4 | ||||||||||
| Asia Pacific | 13 439 | 1 |
| (106 | 13 334 | (0.8 | (0.8 | |||||||||
| Global Export and Holding Companies | 135 |
| (4 | 131 | (2.7 | (2.7 | ||||||||||
| AB InBev Worldwide | 141 829 | (529 | ) | (2 135 | ) | 139 166 | (1.5 | )% | (1.9 | )% | ||||||
| FY24 | Scope | Organic growth | FY25 | Organic growth | ||||||||||||
| Total | Beer | |||||||||||||||
| North America | 86 272 | (961 | (2 577 | 82 734 | (3.0 | (3.9 | ||||||||||
| Middle Americas | 150 086 | (351 | 755 |
| 150 490 | 0.5 | 0.4 | |||||||||
| South America | 160 768 |
| (5 597 | 155 171 | (3.5 | (3.8 | ||||||||||
| EMEA | 93 804 | 147 |
| (629 | 93 323 | (0.7 | (0.7 | |||||||||
| Asia Pacific | 84 397 | (91 | (5 306 | 78 999 | (6.3 | (6.2 | ||||||||||
| Global Export and Holding Companies | 380 | (9 | 13 |
| 383 | 3.4 | 3.4 | |||||||||
| AB InBev Worldwide | 575 706 | (1 265 | ) | (13 341 | ) | 561 100 | (2.3 | )% | (2.6 | )% | ||||||
Key Markets Performance
United States: Building momentum and gaining market share in beer and spirits driven by Michelob Ultra and Cutwater
Mexico: Market share gain and margin expansion drove mid-single digit top- and bottom-line growth
Colombia: Record high volume and margin expansion drove double-digit bottom-line growth
Brazil: Improved momentum in 4Q25 with market share gain driven by our premium portfolio
Europe: Continued market share gains and premiumization partially offset a soft industry
South Africa: Continued momentum and market share gain delivered mid-single digit top- and bottom-line growth
China: Top- and bottom-line declined, impacted by volume performance
Highlights from our other markets
Consolidated Income Statement
| Figure 3. Consolidated income statement | |||||||||
| in USD Mio | 4Q24 | 4Q25 | Organic | ||||||
| growth | |||||||||
| Revenue | 14 841 |
| 15 555 |
| 2.5 | % | |||
| Cost of sales | (6 645 | (6 943 | (2.6 | ||||||
| Gross profit | 8 197 |
| 8 613 |
| 2.5 | % | |||
| SG&A | (4 603 | (4 786 | (1.2 | ||||||
| Other operating income/(expenses) | 231 |
| 223 |
| 10.5 | ||||
| Normalized EBIT | 3 824 |
| 4 049 |
| 4.5 | % | |||
| Non-underlying items above EBIT | 269 |
| (410 | ||||||
| Net finance income/(expense) | (958 | (1 070 | |||||||
| Non-underlying net finance income/(expense) | (701 | 395 |
| ||||||
| Share of results of associates | 103 |
| 133 |
| |||||
| Non-underlying share of results of associates |
|
| |||||||
| Income tax expense | (848 | (720 | |||||||
| Profit | 1 691 |
| 2 377 |
| |||||
| Profit attributable to non-controlling interest | 471 |
| 418 |
| |||||
| Profit attributable to equity holders of AB InBev | 1 220 |
| 1 959 |
| |||||
| Normalized EBITDA | 5 245 |
| 5 473 |
| 2.3 | % | |||
| Underlying Profit | 1 770 |
| 1 884 |
|
| ||||
| FY24 | FY25 | Organic | |||||||
| growth | |||||||||
| Revenue | 59 768 |
| 59 320 |
| 2.0 | % | |||
| Cost of sales | (26 744 | (26 141 | (0.2 | ||||||
| Gross profit | 33 024 |
| 33 179 |
| 3.4 | % | |||
| SG&A | (18 341 | (18 133 | (0.7 | ||||||
| Other operating income/(expenses) | 779 |
| 808 |
| 10.6 | ||||
| Normalized EBIT | 15 462 |
| 15 854 |
| 7.0 | % | |||
| Non-underlying items above EBIT | 25 |
| (449 | ||||||
| Net finance income/(expense) | (4 358 | (4 280 | |||||||
| Non-underlying net finance income/(expense) | (995 | (185 | |||||||
| Share of results of associates | 329 |
| 378 |
| |||||
| Non-underlying share of results of associates | 104 |
| 9 |
| |||||
| Income tax expense | (3 152 | (2 850 | |||||||
| Profit | 7 416 |
| 8 477 |
| |||||
| Profit attributable to non-controlling interest | 1 561 |
| 1 640 |
| |||||
| Profit attributable to equity holders of AB InBev | 5 855 |
| 6 837 |
| |||||
| Normalized EBITDA | 20 958 |
| 21 223 |
| 4.9 | % | |||
| Underlying Profit | 7 061 |
| 7 410 |
|
| ||||
Non-underlying items above EBIT & Non-underlying share of results of associates
| Figure 4. Non-underlying items above EBIT & Non-underlying share of results of associates | ||||||||||||
| in USD Mio | 4Q24 | 4Q25 | FY24 | FY25 | ||||||||
| Restructuring | (60 | (48 | (156 | (116 | ||||||||
| Business and asset disposals (including impairment losses) | 329 |
| (322 | 181 |
| (274 | ||||||
| Claims and legal costs |
| (35 |
| (53 | ||||||||
| Acquisition-related costs (business combinations) |
| (5 |
| (5 | ||||||||
| Non-underlying items in EBIT | 269 |
| (410 | ) | 25 |
| (449 | ) | ||||
| Non-underlying share of results of associates | - |
| - |
| 104 |
| 9 |
| ||||
Normalized EBIT excludes negative non-underlying items of 410 million USD in 4Q25 and 449 million USD in FY25.
Business and asset disposals (including impairment losses) for FY25 mainly comprised a loss of 214 million USD related to the planned sale of the Newark brewery and the closure of two other breweries in the United States and 60 million USD net loss related to the disposal of assets held for sale in Barbados and other Caribbean islands and the sale and impairment of non-core assets.
Non-underlying share of results from associates of FY24 included the impact from our associate Anadolu Efes’ adoption of IAS 29 hyperinflation accounting on their 2023 results.
Net finance income/(expense)
| Figure 5. Net finance income/(expense) | ||||||||||||
| in USD Mio | 4Q24 | 4Q25 | FY24 | FY25 | ||||||||
| Net interest expense | (620 | (607 | (2 704 | (2 566 | ||||||||
| Accretion expense and interest on pensions | (199 | (241 | (811 | (821 | ||||||||
| Other financial results | (139 | (221 | (843 | (893 | ||||||||
| Net finance income/(expense) | (958 | ) | (1 070 | ) | (4 358 | ) | (4 280 | ) | ||||
Non-underlying net finance income/(expense)
| Figure 6. Non-underlying net finance income/(expense) | |||||||||||
| in USD Mio | 4Q24 | 4Q25 | FY24 | FY25 | |||||||
| Mark-to-market | (940 | 395 | (1 211 | (213 | |||||||
| Gain/(loss) on bond redemption and other | 239 |
| 216 |
| 28 |
| |||||
| Non-underlying net finance income/(expense) | (701 | ) | 395 | (995 | ) | (185 | ) | ||||
Non-underlying net finance expense in FY25 includes mark-to-market losses on derivative instruments entered into in order to hedge our share-based payment programs and shares issued in relation to the combination with Grupo Modelo and SAB.
The number of shares covered by the hedging of our share-based payment program, the deferred share instrument and the restricted shares are shown below, together with the opening and closing share prices.
| Figure 7. Non-underlying equity derivative instruments | ||||||||
| 4Q24 | 4Q25 | FY24 | FY25 | |||||
| Share price at the start of the period (Euro) | 59.38 | 50.80 | 58.42 | 48.25 | ||||
| Share price at the end of the period (Euro) | 48.25 | 54.90 | 48.25 | 54.90 | ||||
| Number of equity derivative instruments at the end of the period (in million) | 100.5 | 100.5 | 100.5 | 100.5 | ||||
Income tax expense
| Figure 8. Income tax expense | ||||||||
| in USD Mio | 4Q24 | 4Q25 | FY24 | FY25 | ||||
| Income tax expense | 848 | 720 | 3 152 | 2 850 | ||||
| Effective tax rate | 34.8% | 24.3% | 31.1% | 26.1% | ||||
| Normalized effective tax rate | 26.4% | 27.5% | 26.5% | 26.0% | ||||
The 4Q24, FY24 and FY25 effective tax rates were negatively impacted by non-deductible losses from derivatives related to the hedging of share-based payment programs and of the shares issued in a transaction related to the combinations with Grupo Modelo and SAB, while the 4Q25 effective tax rate was positively impacted by non-taxable gains from these derivatives.
Furthermore, the FY25 effective tax rate included 156 million USD of non-underlying tax income, while the FY24 effective tax rate included 205 million USD of non-underlying tax expense. The difference in Normalized ETR in 4Q25 and FY25 compared to 4Q24 and FY24 was primarily due to country mix.
Underlying EPS
| Figure 9. Underlying EPS | ||||||||||||
| in USD per share, except number of shares in million | 4Q24 | 4Q25 | FY24 | FY25 | ||||||||
| Normalized EBITDA | 2.62 |
| 2.76 |
| 10.46 |
| 10.70 |
| ||||
| Depreciation, amortization and impairment | (0.71 | (0.72 | (2.74 | (2.71 | ||||||||
| Normalized EBIT | 1.91 |
| 2.04 |
| 7.72 |
| 7.99 |
| ||||
| Net finance income/(expense) | (0.48 | (0.54 | (2.18 | (2.16 | ||||||||
| Income tax expense | (0.38 | (0.41 | (1.47 | (1.52 | ||||||||
| Associates & non-controlling interests | (0.18 | (0.15 | (0.62 | (0.62 | ||||||||
| Hyperinflation impacts | 0.02 |
| 0.01 |
| 0.07 |
| 0.04 |
| ||||
| Underlying EPS | 0.88 |
| 0.95 |
| 3.53 |
| 3.73 |
| ||||
| Weighted average number of ordinary and restricted shares | 2 003 |
| 1 984 |
| 2 003 |
| 1 984 |
| ||||
Reconciliation of IFRS and Non-IFRS Financial Measures
Profit attributable to equity holders and Underlying Profit
| Figure 10. Underlying Profit | |||||||||
| in USD Mio | 4Q24 | 4Q25 | FY24 | FY25 | |||||
| Profit attributable to equity holders of AB InBev | 1 220 | 1 959 |
| 5 855 | 6 837 | ||||
| Net impact of non-underlying items on profit | 520 | (94 | 1 062 | 499 | |||||
| Hyperinflation impacts | 31 | 20 |
| 145 | 74 | ||||
| Underlying Profit | 1 770 | 1 884 |
| 7 061 | 7 410 | ||||
Basic and Underlying EPS
| Figure 11. Basic and Underlying EPS | |||||||||
| in USD per share, except number of shares in million | 4Q24 | 4Q25 | FY24 | FY25 | |||||
| Basic EPS | 0.61 | 0.99 |
| 2.92 | 3.45 | ||||
| Net impact of non-underlying items | 0.26 | (0.05 | 0.53 | 0.25 | |||||
| Hyperinflation impacts | 0.02 | 0.01 |
| 0.07 | 0.04 | ||||
| Underlying EPS | 0.88 | 0.95 |
| 3.53 | 3.73 | ||||
| FX translation impact | (0.05 | 0.13 | |||||||
| Underlying EPS in constant currency | 0.88 | 0.90 |
| 3.53 | 3.86 | ||||
| Weighted average number of ordinary and restricted shares | 2 003 | 1 984 |
| 2 003 | 1 984 | ||||
Profit attributable to equity holders and Normalized EBITDA
| Figure 12. Reconciliation of Normalized EBITDA to Profit attributable to equity holders of AB InBev | ||||||||||||
| in USD Mio | 4Q24 | 4Q25 | FY24 | FY25 | ||||||||
| Profit attributable to equity holders of AB InBev | 1 220 |
| 1 959 |
| 5 855 |
| 6 837 |
| ||||
| Non-controlling interests | 471 |
| 418 |
| 1 561 |
| 1 640 |
| ||||
| Profit | 1 691 |
| 2 377 |
| 7 416 |
| 8 477 |
| ||||
| Income tax expense | 848 |
| 720 |
| 3 152 |
| 2 850 |
| ||||
| Share of result of associates | (103 | (133 | (329 | (378 | ||||||||
| Non-underlying share of results of associates |
|
| (104 | (9 | ||||||||
| Net finance (income)/expense | 958 |
| 1 070 |
| 4 358 |
| 4 280 |
| ||||
| Non-underlying net finance (income)/expense | 701 |
| (395 | 995 |
| 185 |
| |||||
| Non-underlying items above EBIT (incl. impairment losses) | (269 | 410 |
| (25 | 449 |
| ||||||
| Normalized EBIT | 3 824 |
| 4 049 |
| 15 462 |
| 15 854 |
| ||||
| Depreciation, amortization and impairment | 1 421 |
| 1 424 |
| 5 496 |
| 5 369 |
| ||||
| Normalized EBITDA | 5 245 |
| 5 473 |
| 20 958 |
| 21 223 |
| ||||
Normalized EBITDA, Normalized EBIT and Underlying Profit are non-IFRS financial measures used by AB InBev to reflect the company’s underlying performance. Underlying EPS and constant currency Underlying EPS are non-IFRS financial measures that AB InBev believes are useful to investors because they facilitate comparisons of EPS from period to period.
Normalized EBITDA is calculated by adjusting profit attributable to equity holders of AB InBev to exclude: (i) non-controlling interest; (ii) income tax expense; (iii) share of results of associates; (iv) non-underlying share of results of associates; (v) net finance income or cost; (vi) non-underlying net finance income or cost; (vii) non-underlying items above EBIT; and (viii) depreciation, amortization and impairment.
Underlying Profit is calculated by adjusting profit attributable to equity holders of AB InBev to exclude: (i) non-underlying items and (ii) hyperinflation impacts. Underlying EPS is calculated as Underlying Profit divided by the weighted average number of ordinary and restricted shares. Constant currency Underlying EPS is calculated as Underlying EPS excluding the effects of foreign currency translation by translating current period figures using the exchange rates from the same period in the prior year.
Normalized EBITDA, Normalized EBIT and Underlying Profit are not accounting measures under IFRS and should not be considered as an alternative to profit attributable to equity holders as a measure of operational performance, or an alternative to cash flow as a measure of liquidity. Underlying EPS and constant currency Underlying EPS are not accounting measures under IFRS and should not be considered as alternatives to earnings per share as a measure of operating performance on a per share basis. These non-IFRS financial measures do not have a standard calculation method and AB InBev’s definition of Normalized EBITDA, Normalized EBIT, Underlying Profit, Underlying EPS and constant currency Underlying EPS may not be comparable to that of other companies.
Cash Flows and Financial position
| Figure 13. Cash Flow Statement (million USD) | ||||||
| FY24 | FY25 | |||||
| Operating activities | ||||||
| Profit of the period | 7 416 |
| 8 477 |
| ||
| Interest, taxes and non-cash items included in profit | 13 990 |
| 13 160 |
| ||
| Cash flow from operating activities before changes in working capital and use of provisions | 21 406 |
| 21 637 |
| ||
|
| ||||||
| Change in working capital | (22 | (398 | ||||
| Pension contributions and use of provisions | (374 | (426 | ||||
| Interest and taxes (paid)/received | (6 189 | (6 126 | ||||
| Dividends received | 234 |
| 195 Hinweis: ARIVA.DE veröffentlicht in dieser Rubrik Analysen, Kolumnen und Nachrichten aus verschiedenen Quellen. Die ARIVA.DE AG ist nicht verantwortlich für Inhalte, die erkennbar von Dritten in den „News“-Bereich dieser Webseite eingestellt worden sind, und macht sich diese nicht zu Eigen. Diese Inhalte sind insbesondere durch eine entsprechende „von“-Kennzeichnung unterhalb der Artikelüberschrift und/oder durch den Link „Um den vollständigen Artikel zu lesen, klicken Sie bitte hier.“ erkennbar; verantwortlich für diese Inhalte ist allein der genannte Dritte. Weitere Artikel des AutorsThemen im Trend | |||


