Silverado (OTCBB - SLGLF) had a good run when it surged more than 220% last October from $0.049 to $0.157 in April 2007. It then spent the next five months jigging lower before putting in a bottom of $0.067 in August. Since then however, the stock has been pushing slowly but steadily higher.
In the process, it put in a price-volume support base between $0.07 and $0.08 together with a series of higher lows and higher highs that indicate an up trend. This base occurred on lower than average volume which while typical of a consolidation pattern, has positive technical implications for the stock. Over the last 50 days, daily volume has averaged 2.4 million shares. This compares to an average daily volume of 6.2 million shares in early March as the stock approached its April peak.
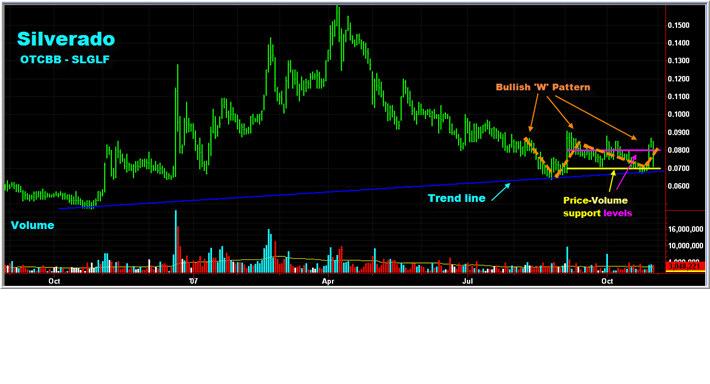
Figure 1 – Daily chart of Silverado showing bottoming of the stock at $0.067 in August 2007 and recent uptrend through October. Trend line (blue) shows the low in October 2006 and support in August through October 2007. Positives include strong-price volume support between $0.07 and $0.08 (blue and magenta lines) and a bullish catapult or ‘W’ pattern (orange) that began forming in late July 2007. Chart provided by TradeStation.com
Month Total Vol. Short Vol. Avg. Price Short $ Value
----- ---------- ---------- ---------- -------------
November '05 47,415,264 3,650,975 $ 0.05 $ 185,470
December 47,438,328 3,652,751 $ 0.05 $ 199,075
January '06 122,033,336 9,396,567 $ 0.07 $ 615,475
February 189,994,688 14,629,591 $ 0.13 $ 1,891,606
March 156,206,576 12,027,906 $ 0.13 $ 1,539,572
April 61,520,024 4,737,042 $ 0.14 $ 653,712
May 101,845,760 7,842,124 $ 0.13 $ 1,043,002
June 78,434,792 6,039,479 $ 0.09 $ 557,444
July 45,359,144 3,492,654 $ 0.07 $ 253,916
August 51,298,712 3,950,001 $ 0.06 $ 246,480
September 37,960,444 2,922,954 $ 0.06 $ 167,778
October 44,988,568 3,464,120 $ 0.05 $ 184,291
November 62,318,912 4,798,556 $ 0.07 $ 322,463
December 107,849,968 8,304,448 $ 0.09 $ 749,892
January '07 111,579,096 8,591,590 $ 0.09 $ 788,708
February 112,156,848 8,636,077 $ 0.11 $ 951,696
March 64,966,144 5,002,393 $ 0.12 $ 591,283
April 89,153,200 6,864,796 $ 0.14 $ 939,104
May 79,993,216 6,159,478 $ 0.11 $ 684,934
June 52,376,568 4,032,996 $ 0.10 $ 390,797
July 41,647,588 3,206,864 $ 0.09 $ 287,014
August 58,672,384 4,517,774 $ 0.08 $ 346,061
September 48,592,360 3,741,612 $ 0.08 $ 288,478
October 48,328,000 3,721,256 $ 0.08 $ 290,630
Total: 1,862,129,920 143,384,004 $ 0.099 $ 14,168,881
(x) short volume is approximated using a proprietary algorithm.
(xx) average short price is calculated using a volume weighted average
short price.
(xxx) short volume is the total short trade volume and does not account
for covers.
A recent technical report from Trade System Guru has been released at:
tradesystemguru.com/content/view/102/9/
This report reveals the current technical formation of SLGLF and a potential breakout that is forming.
(Verkleinert auf 78%)