Asset Klassen
Kurslisten
Hinweis zu Meine Suchen: Meine Suchen sind aufgrund der vielfachen Bitte aus der Community wieder unter Mein Portfolio zu finden.
Meistgeklickt









Hot News
Heiße Themen (24h)

| Geld/Brief | 2,56 $ / 3,63 $ |
| Spread | +41,80% |
| Schluss Vortag | 3,30 $ |
| Gehandelte Stücke | 9.320 |
| Tagesvolumen Vortag | 20.691,28 $ |
| Tagestief 3,14 $ Tageshoch 3,33 $ | |
| 52W-Tief - 52W-Hoch 3,25 $ | |
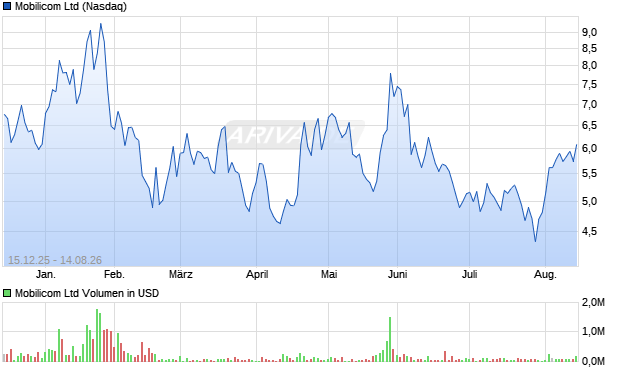
| Jahrestief 2,79 $ Jahreshoch 9,75 $ | |
| Umsatz in Mio. | 3,36 $ |
| Operatives Ergebnis (EBIT) in Mio. | -23,79 $ |
| Jahresüberschuss in Mio. | -23,72 $ |
| Umsatz je Aktie | 0,38 $ |
| Gewinn je Aktie | -2,68 $ |
| Gewinnrendite | -705,36% |
| Umsatzrendite | -705,36% |
| Return on Investment | -114,42% |
| Marktkapitalisierung in Mio. | 40,53 $ |
| KGV (Kurs/Gewinn) | -2,28 |
| KBV (Kurs/Buchwert) | 6,10 |
| KUV (Kurs/Umsatz) | 16,05 |
| Eigenkapitalrendite | - |
| Eigenkapitalquote | +42,55% |

| Handelsplatz | Letzter | Änderung | Vortag | Zeit | |
|---|---|---|---|---|---|
| Nasdaq | 3,25 $ | -1,52% | 3,30 $ | 30.10.26 | |
| NYSE | 3,275 $ | -2,96% | 3,375 $ | 30.10.26 | |
| NYSE American | 2,80 $ | - | - | 16.10.26 | |
| Datum | Kurs | Volumen |
|---|---|---|
| 30.10.26 | 3,27 | 20.691 |
| 29.10.26 | 3,30 | 9.520 |
| 28.10.26 | 3,40 | 29.500 |
| 27.10.26 | 3,29 | 17.882 |
| 26.10.26 | 3,215 | 24.501 |
| Zeitraum | Kurs | % |
|---|---|---|
| 1 Woche | 3,15 $ | +3,17% |
| 1 Monat | 4,50 $ | -27,78% |
| 6 Monate | 6,29 $ | -48,33% |
| 1 Jahr | - | - |
| 5 Jahre | - | - |
| Marktkapitalisierung | 40,53 Mio. $ |
| Streubesitz | 62,68% |
| Währung | USD |
| Land | USA |
| Sektor | Industrie |
| Branche | Luftfahrt- & Verteidigung |
| Aktientyp | Stammaktie |
| +6,95% | Wexford Capital LP |
| +3,30% | Bard Associates Inc |
| +1,72% | Marshall Wace Asset Management Ltd |
| +1,10% | Jane Street Group LLC |
| +0,62% | Diametric Capital, LP |
| +0,53% | Citadel Advisors Llc |
| +0,35% | FourWorld Capital Management LLC |
| +0,22% | Dauntless Investment Group, LLC |
| +0,17% | HRT FINANCIAL LLC |
| +0,16% | XTX Topco Ltd |
| +0,12% | Hennion & Walsh Asset Management Inc |
| +0,12% | Morgan Stanley - Brokerage Accounts |
| +0,1% | CI Private Wealth LLC |
| +0,08% | Two Sigma Investments LLC |
| +0,06% | Corgi Drones & Urban Air Mobility ETF |
| +0,05% | JPMorgan Chase & Co |
| +0,05% | Advisor Group Holdings, Inc. |
| +0,03% | Persistent Asset Partners Limited |
| +0,01% | Nisa Investment Advisors, L.L.C. |
| +0,01% | JONES FINANCIAL COMPANIES LLLP |
| +0,01% | GAMMA Investing LLC |
| +23,346% | Institutionelle Aktionäre |
| +13,975% | Insider Aktionäre |
| +62,679% | Streubesitz |