







EQUITY INNS INC. DL-,01

Aktie
WKN:  900212 ISIN:  US2947031033
Keine aktuellen Kursdaten verfügbar
Depot/Watchlist
Dieses Wertpapier ist nicht mehr handelbar.
Marktkapitalisierung *
-
Streubesitz
-
KGV
-
Index-Zuordnung
-
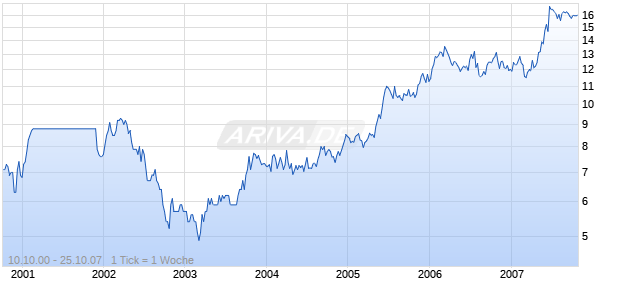
EQUITY INNS INC.   DL-,01 Chart

Dividenden Historie

Datum Dividende
26.09.2007 0,18 €
27.06.2007 0,19 €
28.03.2007 0,19 €
27.12.2006 0,17 €
27.09.2006 0,18 €
Werbung

Mehr Nachrichten kostenlos abonnieren

E-Mail-Adresse
Benachrichtigungen von ARIVA.DE
(Mit der Bestellung akzeptierst du die Datenschutzhinweise)

EQUITY INNS INC. DL-,01 Termine

Keine Termine bekannt.

EQUITY INNS INC. DL-,01 Prognose 2026: Einstufung & Empfehlung von Analysten

EQUITY INNS INC. DL-,01 Kursziel 2026

  • Die EQUITY INNS INC. DL-,01 Kurs Performance für 2026 liegt bei -.

Stammdaten

Aktientyp Stammaktie

Community-Beiträge zu EQUITY INNS INC. DL-,01

  • Community-Beiträge
  • Aktuellste Threads
Avatar des Verfassers
Mme.Eugenie
Royal Caribbean Cruises Ltd. (nyse: RCL
STOCK OF THE WEEK - MAY 30, 2006

Royal Caribbean Cruises Ltd. (nyse: RCL)


Kelley Wright, editor of Investment Quality Trends, recommends that investors take advantage of current weakness and buy shares of cruise operator Royal Caribbean Cruises (nyse: RCL). The Miami-based cruise vacation company operates Royal Caribbean International and Celebrity Cruises, with a combined total of 29 ships in service and five under construction.

Within the past month, shares of RCL are down more than 15%, and have declined better than 21% year-to-date, closing Friday at a 52-week low of $35.29. Royal Caribbean’s larger rival, Carnival Corp. (CCL), has also been a weak performer in 2006, down 24% on the year. Both operators are dealing with the effects of higher fuel costs and potential passengers’ fear of hurricanes in the Caribbean.

To compound the bad news, RCL’s Celebrity Cruises had one of its captains busted for drinking before sailing from Seattle for Alaska on May 19 .

Quelle forbes

ROYAL CARIBBEAN CRUISES - New York Stock Exchange: RCL (NEW charting help)

<!--VITALS="app:interactivecharting lic:destination sale:kek web:kjb ops:ccn tech:cdt"-->
Enter Symbol or Keyword:Time Frame: 
1-day2 days5 days10 days----------1 month2 months3 months6 monthsYTD1 year2 years3 years4 years5 years1 decadeAll Data Additional chart controls
 RCL - Royal Caribbean Cruises Ltd. (NYSE)5/31/2006 
Avatar des Verfassers
Mme.Eugenie
Equity Inns (nyse: ENN)

STOCK OF THE WEEK - MAY 22, 2006

Equity Inns (nyse: ENN)


Peter Slatin, editor of the Forbes/Slatin Real Estate Report, recommends buying Equity Inns Inc. (nyse: ENN), the Germantown, Tennessee real estate investment trust that owns upscale extended-stay hotel properties throughout the United States.  Publicly traded since 1994, Equity is the oldest public hotel REIT in the U.S.

ENN closed Friday at $15.43 per share and has returned 15.2% in year-to-date, including a $0.19 per share dividend paid on March 29.  The REIT is down 16.3% from its May 6 high of $18.43.

On May 4, Equity Inns reported adjusted funds from operations (AFFO) of 34 cents per share, up 36% from the first quarter of 2005.  AFFO excludes a non-cash impairment charge of $8.9 million for writing down the value of four older hotels that may be sold in the near future.  Overall, the company’s first quarter net loss totaled $3.3 million, versus net income of $1.8 million for the first quarter a year ago.

SPECIAL OFFER


LEARN THE ABC’s OF OPTIONS AND FUTURES

If you’re like many investors, you’ve been too busy to take advantage of the potential profit and protection benefits of options and futures. Now Horizon Capital Management Group has a FREE introduction to these important tools – available as a CD, cassette or video. Whether you’re a new or experienced trader, simply click to qualify for this important information.

Total quarterly revenue grew 30% to $94 million, while revenue per available room, or RevPAR (the average daily rate multiplied by occupancy), grew 10.2%.  The company’s gross operating profit margin grew by 2.6 percentage points. 

ENN’s portfolio consists of 125 hotels with approximately 15,000 rooms in 36 states.  The properties are managed by many of the leading lodging and hotel management companies and include Hyatt’s AmeriSuites, Homewood Suites, Hampton Inn, Hilton Garden Inn, Residence Inn, and Courtyard, SpringHill Suites, and TownePlace Suites by Marriott.

The first quarter common stock dividend of $0.19 per share represents an increase of 27% from the first quarter 2005. ENN has increased its dividend three times since the first quarter of 2004, and its trailing twelve months' payout ratio was 64%.

<!-- leaderboard tile -->< script language=JavaScript>if(symb == null) var symb = "";if(rsistring == null) var rsistring = "";// create/insert ad type from varvar tkr = symb;if (document.cookie.indexOf("ad_cookie") == -1) {     document.write('< iframe SRC="http://ad.doubleclick.net/adi/realmoney.com/tools;dcopt=ist;tkr=' + tkr + ';sz=728x90;' + rsistring + 'ord=' + ord + '?" width=728 height=90 frameborder=no border=0 MARGINWIDTH=0 MARGINHEIGHT=0 SCROLLING=no>');} else {     var cookieKval = readCookie('ad_cookie');     document.write('< iframe SRC="http://ad.doubleclick.net/adi/realmoney.com/tools;dcopt=ist;kval=' + cookieKval + ';tkr=' + tkr + ';sz=728x90;' + rsistring + 'ord=' + ord + '?" width=728 height=90 frameborder=no border=0 MARGINWIDTH=0 MARGINHEIGHT=0 SCROLLING=no>');}document.write('');document.write('');< /script>< iframe border=0 marginWidth=0 marginHeight=0 src="http://ad.doubleclick.net/adi/realmoney.com/tools;dcopt=ist;tkr=enn;sz=728x90;rsi=;ord=5139174997220782?" frameBorder=no width=728 scrolling=no height=90><AHREF="http://ad.doubleclick.net/jump/realmoney.com/tools;abr=!ie;tkr=enn;sz=728x90;rsi=;ord=5139174997220782?"><IMGSRC="http://ad.doubleclick.net/ad/realmoney.com/tools;abr=!ie;tkr=enn;sz=728x90;rsi=;ord=5139174997220782?"border=0 height=90 width=728></a>< /iframe>
TheStreet.comRealMoney.comFREE MembersTheStreet.com Premium Products< script language=JavaScript1.2>document.write('');< /script>LogoutHelp
RealMoney
< script language=javascript>// write correct subnavvar subnavgif = "Quotes";switch(pg) {     case "qcn": subnavgif="rmy_quotes_tab_q.gif"; break;     case "usmarkets": subnavgif="rmy_quotes_tab_usm.gif"; break;     case "Economic Calendar": subnavgif="rmy_quotes_tab_ec.gif"; break;     case "currency": subnavgif="rmy_quotes_tab_gm.gif"; break;     default: subnavgif="rmy_quotes_tab_q.gif"; break;}document.writeln('');< /script> QuotesEconomic CalendarUS MarketsGlobal Markets
<!-- includes ad buttons tile -->< script language=javascript>function adbuttons() {var no_ads =10;var adlink = new Array();var old = new Array();adlink[1] = '
OptionsXpress';adlink[2] = '

Schwab Active Trader
';adlink[3] = '
CyberTrader
';adlink[4] = '
MoneyNews.com
'adlink[5] = '
T.Rowe Price
'adlink[6] = '
Ameritrade
'adlink[7] = '
ISE
'adlink[8] = '
FXCM
'adlink[9] = '
Forex.com
'document.open();for (u=0; u' + adlink[r] + "");old[i] = r;}document.close();}adbuttons();< /script>
$7 TRADES!
Scottrade

Power E*TRADE

Fidelity Brokerage

CyberTrader

Schwab Active Trader

FXCM

<!-- js include -->< script language=javascript src="http://www.bigcharts.com/custom/thestreet-com/html-intchart.asp?osymb=SPWR&pg=intchart&timer=&mode=&symb=enn&go_btn=Go&sid=2156250&time=1yr&freq=1dy&type=64&uf=0&comp=&lf=1&compidx=aaaaa%7E0&ma=0&maval=60">< /script>< script language=JavaScript><!--var oldHeight=-1var oldWidth=-1function netscapeFix() {  if (oldWidth != window.innerWidth || oldHeight != window.innerHeight) {     document.location.reload();}}function netscapeFixCheckIn() { if (document.layers) {    oldWidth = window.innerWidth;   oldHeight = window.innerHeight;   window.onresize = netscapeFix; }}netscapeFixCheckIn()//-->< /script>
< script language=JavaScript><!--function printit(){if (window.print) {window.print() ;} else {          var WebBrowser = '< object ID="WebBrowser1" WIDTH=0 HEIGHT=0 CLASSID="CLSID:8856F961-340A-11D0-A96B-00C04FD705A2">< /object>';document.body.insertAdjacentHTML('beforeEnd', WebBrowser);WebBrowser1.ExecWB(6, 2);//Use a 1 vs. a 2 for a prompting dialog box    WebBrowser1.outerHTML = "";}}//-->< /script>
 Quotes   
< script>function setFocus(){if(document.frmMKTW.symb){document.frmMKTW.symb.focus();document.frmMKTW.symb.select();}}setFocus();< /script>
<!-- PRODUCTION: 1 -->
More Information for Equity Inns, Inc.
Quote Summary
>Basic Chart
Java Chart
Option Chain

Income Statement
Balance Sheet
Cash Flow
Earnings Estimates

Company Profile
SEC Filings
Insider
Analyst Ratings

Free Annual Reports
Second Opinion
More Financial Information
Streaming Quotes
Glossary
  ENN    Equity Inns, Inc. (NYSE)15.14+0.09   ( +0.60%)12:00 PM ET 5/24/06 
  Basic Charting
Time Frame:
1-day2 days5 days10 days----------1-month2 months3 months6 monthsYTD1-year2 years3 years4 years5 years1-decadeAll Data
Frequency:
1-Minute5-Minute15-MinuteHourly----------DailyWeeklyMonthlyQuarterlyYearly
Price Display:
Hide PriceHLCOHLCCandlestickMountainBar ChartsDotCloseLogarithmic
Upper Indicator:
<None>Show SplitsShow EarningsShow DividendsShow All Events

Compare to Symbols:
Lower Indicator:
VolumeVolume+RSIMACDOBVFast StochasticSlow StochasticROCWilliams %RMoney FlowDMIVol AccumulationVolatility FastVolatility SlowMomentumUlt Oscillator% Short InterestRolling EPSP/E RatioP/E RangesRolling DividendYield----------Up/Down RatioArms Index (TRIN)A/D Line (Breadth)A/D Line (Daily)----------% Compare
Compare to Index:
<None>S&P 500DJIANASDAQ----------Russell 2000TechnologyInternetBroker/DealersOil & GasGold & SilverUtilitiesTransportationAirlines
Moving Averages:
<None>SMASMA (2-Line)SMA (3-Line)EMAEMA (2-Line)EMA (3-Line)
Print this chart.
Before you trade - Get a Second OpinionTM

Find out if Jim Cramer is talking about this stock

Kenneth Fisher
<!-- begin ad tag -->
<!---- To be placed at the end of the HTML page code, just before the /BODY tag --------><!-- end ad tag -->

Copyright © 1999-2006 BigCharts.com Inc. All rights reserved. Please see our Terms of Use.
Intraday data provided by ComStock, a division of Interactive Data Corp, and subject to the Terms of Use.
Intraday data is at least 20-minutes delayed. All times are ET.
Historical and current end-of-day data provided by FT Interactive Data.
Fundamental Data Provided by Hemscott.


< script language=JavaScript src="http://context3.kanoodle.com/cgi-bin/context.cgi?id=80088824&db=context&query=finance:stocks&cgroup=markets&format=table1&newtarget=1&width=430&title=1">< /script>
  Sponsored Links


© 1996-< script language=JavaScript>date = new Date().getFullYear();document.write(date);< /script>2006 TheStreet.com, Inc. All rights reserved.
< script language=JavaScript>var subsection = "Stock Quotes";if(pg != null) subsection = pg;var path = document.location.pathname;var puc = "";var index = path.indexOf("/_");if(index > -1) {     puc = path.substring(index+1, path.indexOf("/rmy", index));}var pi = ("RMY Quotes: " +subsection +puc + "|" +symb.toUpperCase());var cg = ("RMY Quotes");if (location.href.match("http://tools.thestreet.com")) cmSetProduction();if(symb != null) {     search_term = ("RMY Quotes|" +symb.toUpperCase());     cmCreatePageviewTag(pi, cg, search_term);} else {     cmCreatePageviewTag(pi, cg);}< /script> <!-- Revenue Science -->< script language=JavaScript>document.write("");< /script>< script language=JavaScript1.2 src="http://www.thestreet.com/tsc/common/javascript/dm_client.js" type=text/javascript>< /script>< script language=JavaScript>< /script>          <!--The Page Area is EMPTY-->Financial News Jim Cramer Latest Stories Personal Finance Markets Video and Audio About UsCompany & Market Analysis 30 Days FREE Jim Cramer's Blog Commentary Columnist Conversation TheStreet Notes Newsletters Select RealMoney Content Cramer Radio Discount OffersSpecialized subscription products from TheStreet.com RealMoney Action Alerts PLUS TheStreet.com Stocks Under $10 TheStreet.com Breakout Stocks TheStreet.com Internet Review TheStreet.com Options Alerts The Value Investor TheStreet.com Top Stocks The Daily Swing Trade The Trading Reports The Telecom Connection Dividend Stock Advisor TheStreet.com Short Advisor Street Insight
Avatar des Verfassers
Mme.Eugenie
Die Aktie der Woche
STOCK OF THE WEEK - MAY 15, 2006 Nicholas-Applegate Int’l & Premium Strategy Fund (nyse: NAI) -------------------------------------------------------------------------------- Jack Colombo, editor of the ISA ETF Investor, recommends buying the Nicholas-Applegate International Premium & Strategy Fund (nyse: NAI), a closed-end fund that invests in international equities and enhances total return by writing covered calls to generate income. The fund came to market just over a year ago on April 27, 2005 with a net asset value (NAV) of $23.88 and an anticipated yield of 9.00%. As of Friday, May 12, 2006, the market price of the fund’s shares rose 7.56% and the fund paid out $2.15 per share over the past 12 months. Based on the trailing twelve months’ of payout, the current yield of the NAI is 7.99%. The NAI belongs to a new class of closed-end funds that use a buy-write strategy to enhance its returns to shareholders. The buy-write strategy involves selling near- or out-of-the-money call options on the common stocks in their portfolio. SPECIAL OFFER -------------------------------------------------------------------------------- TAKE BERNIE SCHAEFFER'S GOLD TRIAL Now qualified investors can enjoy a FREE 60 day trial to "Schaeffer's Gold", featuring renowned investment guru Bernie Schaeffer’s premium commentary, tools, data and filters. Includes the Equity Scorecard, Daily Stock Ideas, the Trading Floor Blog and more. Qualify now. “The buy-write strategy has been back tested against the S&P 500 Index and results show a small increase in overall return, but a large reduction in volatility,” says Colombo. “The typical ETF is created to mimic a particular index and the Nicholas-Applegate International Premium & Strategy Fund is an oddity in the closed end fund universe because it attempts to mimic an ETF, specifically the iShares MSCI EAFE Index (amex: EFA).” Although the NAI is designed to track the MSCI EAFE Index, the closed end fund has a few significant advantages, says Colombo. “Chief among them is that you can own the fund at a 11.2% discount to its $30.30 net asset value,” noting that the value of the fund’s investments exceeds the per share price. “In addition,” says Colombo, “since the net asset value has only recently appreciated to $30 due to weakness in the U.S. dollar, it is possible that the fund’s distributions will be increased as well.” SPECIAL OFFER -------------------------------------------------------------------------------- Generate Double-Digit Yields from Oil and Gas Click here for Richard Lehmann's Canadian royalty trust picks with yields of 11% and higher...in Forbes/Lehmann Income Securities Investor. Another positive is that the fund may likely generate more income by selling calls on its higher net asset value portfolio. Also encouraging is the strong performance of the underlying ETF, the iShares MSCI EAFE Index. The EFA is up 34% in the past year, and up nearly 11% year-to-date. As a way to generate portfolio income and to play the continued strength of international markets, Colombo recommends buying NAI at current prices. Click here for more ETF and closed-end fund recommendations and updates from Jack Colombo, and to learn more about subscribing to ISA ETF Investor. Quelle forbes NAI Nicholas-Applgt Intl & Prm Str (NYSE) Delayed quote data 5/16/2006 1:53 PM hide quote detailed quote options chain add to favorites list favorites chart help Help on Interactive Charting Last: 26.94 Change: +0.16 Open: 26.78 High: 26.97 Low: 26.77 Volume: 27,200 Percent Change: +0.60% Yield: 7.98% P/E Ratio: n/a 52 Week Range: 22.16 to 27.52 News | Market Advisers | Analysts | SEC Filings | Insiders | Annual Report | Profile Create Alert | Add to Portfolio | Read Messages | Technical Analysis | Hulbert Interactive
Jetzt anmelden und diskutieren Registrieren Login
Zum Thread wechseln

Häufig gestellte Fragen zur EQUITY INNS INC. DL-,01 Aktie und zum EQUITY INNS INC. DL-,01 Kurs

Ja, EQUITY INNS INC. DL-,01 zahlt Dividenden. Zuletzt wurde am 26.09.2007 eine Dividende in Höhe von 0,18 € gezahlt.

Zuletzt hat EQUITY INNS INC. DL-,01 am 26.09.2007 eine Dividende in Höhe von 0,18 € gezahlt.
Dies entspricht einer Dividendenrendite von 0,00%. Die Dividende wird vierteljährlich gezahlt.

Die letzte Dividende von EQUITY INNS INC. DL-,01 wurde am 26.09.2007 in Höhe von 0,18 € je Aktie ausgeschüttet.
Das ergibt, basierend auf dem aktuellen Kurs, eine Dividendenrendite von 0,00%.

Die Dividende wird vierteljährlich gezahlt.

Der letzte Zahltag der Dividende war am 26.09.2007. Es wurde eine Dividende in Höhe von 0,18 € gezahlt.

Um eine Dividende ausgezahlt zu bekommen, muss man die Aktie am Ex-Tag (Ex-Date) im Depot haben.