
- Community-Beiträge
- Aktuellste Threads


| Geld/Brief | 21,21 $ / 21,24 $ |
| Spread | +0,14% |
| Schluss Vortag | 21,21 $ |
| Gehandelte Stücke | 137.867 |
| Tagesvolumen Vortag | 1.251.036 $ |
| Tagestief 21,21 $ Tageshoch 21,21 $ | |
| 52W-Tief 15,66 $ 52W-Hoch 29,50 $ | |
| Jahrestief 15,66 $ Jahreshoch 23,54 $ | |


| Umsatz in Mio. | 6.276 $ |
| Operatives Ergebnis (EBIT) in Mio. | 552,30 $ |
| Jahresüberschuss in Mio. | 1.404 $ |
| Umsatz je Aktie | 53,18 $ |
| Gewinn je Aktie | 11,95 $ |
| Gewinnrendite | +22,36% |
| Umsatzrendite | +22,36% |
| Return on Investment | +4,96% |
| Marktkapitalisierung in Mio. | 2.453 $ |
| KGV (Kurs/Gewinn) | 13,04 |
| KBV (Kurs/Buchwert) | 0,79 |
| KUV (Kurs/Umsatz) | 2,92 |
| Eigenkapitalrendite | +6,09% |
| Eigenkapitalquote | +81,39% |
| Knock-Outs | 15 | |
| Faktor-Zertifikate | 13 |
| Dividendenrendite 6,92% |
| Auszahlungen/Jahr 2 |
| Gesteigert seit 1 Jahr |
| Keine Senkung seit 1 Jahr |
| Stabilität der Dividende 0,05 (max 1,00) |
| Jährlicher 18,38% (5 Jahre) Dividendenzuwachs |
| Ausschüttungs- 341,04% (auf den Gewinn/FFO) quote % (auf den Free Cash Flow) |
| Erwartete Dividendensteigerung -48,06% |
| Datum | Dividende |
| 02.07.2026 | 0,66 $ |
| 31.12.2025 | 1,20 $ |
| 20.10.2025 | 0,59 $ |
| 31.12.2024 | 1,15 $ |
| 10.07.2024 | 0,57 $ |
| 28.12.2023 | 1,15 $ |
| 20.03.2023 | 0,58 $ |
| 18.03.2022 | 0,51 $ |

| Handelsplatz | Letzter | Änderung | Vortag | Zeit | |
|---|---|---|---|---|---|
| AMEX | 21,36 $ | +0,23% | 21,31 $ | 28.09.26 | |
| Düsseldorf | 18,70 € | +1,08% | 18,50 € | 28.09.26 | |
| Frankfurt | 17,80 € | -4,30% | 18,60 € | 28.09.26 | |
| Gettex | 18,80 € | +1,08% | 18,60 € | 28.09.26 | |
| L&S RT | 18,75 € | +0,27% | 18,70 € | 28.09.26 | |
| München | 18,60 € | 0 % | 18,60 € | 28.09.26 | |
| Nasdaq | 21,23 $ | -0,42% | 21,32 $ | 28.09.26 | |
| NYSE | 21,21 $ | 0 % | 21,21 $ | 01:00 | |
| Quotrix | 18,60 € | -1,06% | 18,80 € | 28.09.26 | |
| Stuttgart | 18,60 € | +0,54% | 18,50 € | 28.09.26 | |
| Tradegate | 18,60 € | -0,53% | 18,70 € | 23.09.26 | |
| Datum | Kurs | Volumen |
|---|---|---|
| 25.09.26 | 21,33 | 1,32 M |
| 24.09.26 | 21,30 | 1,17 M |
| 23.09.26 | 21,35 | 1,55 M |
| 22.09.26 | 21,31 | 1,39 M |
| 21.09.26 | 21,35 | 0,69 M |
| Zeitraum | Kurs | % |
|---|---|---|
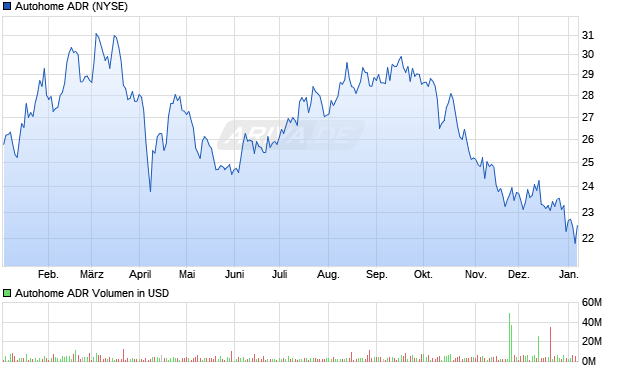
| 1 Woche | 21,35 $ | -0,09% |
| 1 Monat | 22,83 $ | -6,57% |
| 6 Monate | 16,92 $ | +26,06% |
| 1 Jahr | 29,04 $ | -26,55% |
| 5 Jahre | 44,06 $ | -51,59% |
| Marktkapitalisierung | 2,45 Mrd. $ |
| Streubesitz | 53,35% |
| Währung | USD |
| Land | USA |
| Sektor | Kommunikation |
| Branche | Elektronische Medien |
| Aktientyp | ADR |
| +5,99% | Amvescap Plc. |
| +3,52% | Acadian Asset Management LLC |
| +3,02% | Fidelity International Ltd |
| +2,97% | BlackRock Inc |
| +2,72% | Fidelity Global Technology A-Dis-EUR |
| +2,57% | M&G PLC |
| +2,48% | KraneShares CSI China Internet ETF |
| +2,29% | Krane Funds Advisors LLC |
| +2,20% | Vanguard Group Inc |
| +1,86% | North of South Capital LLP |
| +1,79% | Mondrian Investment Partners Ltd |
| +1,73% | Robeco Institutional Asset Management BV |
| +1,69% | Vanguard Capital Management, LLC |
| +1,46% | Invesco Asian UK Acc |
| +1,21% | Pacific North of South EM All Cp EqZ£Acc |
| +1,18% | Federated Hermes Inc |
| +1,09% | State Street Corp |
| +1,03% | Schroder Investment Management Group |
| +1,00% | Polunin Capital Partners Ltd |
| +0,98% | Federated Hermes Asia exJpn Eq R EUR Acc |
| +0,83% | AQR Capital Management LLC |
| +0,75% | Vanguard Total Intl Stock Index Inv |
| +0,68% | Invesco Asian Equity C USD AD |
| +0,67% | Fidelity FAP-INVESCO Asian Equity Core A |
| +0,65% | Vanguard Emerging Mkts Stock Idx Inv |
| +0,59% | Global X SuperDividend™ ETF |
| +0,59% | Invesco Emerging Mkt Eq Z USD AD |
| +0,58% | UBS Asset Mgmt Americas Inc |
| +0,56% | Goldman Sachs Group Inc |
| +0,55% | The Goldman Sachs Group Inc |
| +0,55% | Robeco QI EM Active Equities I € |
| +0,53% | Jane Street Group LLC |
| +0,52% | M&G (ACS) China GBPZ1A Acc |
| +0,50% | Qube Research & Technologies |
| +0,49% | iShares Core MSCI Emerging Markets ETF |
| +0,49% | Schroder Global Recovery L Acc GBP |
| +0,47% | iShares EM Dividend ETF USD Dist |
| +0,47% | Long Corridor Asset Management Ltd |
| +0,45% | Vanguard Fiduciary Trust Co |
| +0,44% | Global X SuperDividend ETF USD Cap |
| +0,44% | iShares Emerging Markets Dividend ETF |
| +0,44% | D. E. Shaw & Co LP |
| +0,43% | Legal & General Group PLC |
| +0,42% | Morgan Stanley - Brokerage Accounts |
| +0,4% | First Trust NASDAQ Technology Div ETF |
| +0,4% | NORGES BANK |
| +0,39% | American Century Companies Inc |
| +0,39% | Vanguard Instl Ttl Intl Stk Mkt Idx TrII |
| +0,38% | Citadel Advisors Llc |
| +0,38% | HSBC Holdings PLC |
| +0,38% | UBS Group AG |
| +0,38% | Schroder ISF Glbl Rcvy E Acc USD |
| +0,36% | Avantis Emerging Markets Equity ETF |
| +0,36% | Geode Capital Management, LLC |
| +0,35% | Aberdeen Group PLC |
| +0,35% | Pictet Asset Manangement SA |
| +0,35% | Invesco China Technology ETF |
| +0,35% | BOCOM Schroders CSI OS China(QDII-LOF)A |
| +0,32% | Dimensional Fund Advisors, Inc. |
| +0,32% | Oasis Management Co. Ltd |
| +0,31% | Invesco Global Emerg Mkts UK Acc |
| +0,29% | M&G Asian GBP A Acc |
| +0,27% | Nedgroup Inv Opportunity A1 |
| +0,25% | Fidelity Pacific Basin |
| +46,653% | Institutionelle Aktionäre |
| +53,347% | Streubesitz |
https://www.investors.com/research/the-new-america/chinas-king-of-automotive-websites-still-has-room-to-grow/
Autohome (ATHM) is on the move, and as the company focuses on big data to drive future growth, analysts believe there could be more room for the stock to run.
Initiating coverage on China's online destination for all-things-automotive with a buy rating on Jan. 2, Citi said that Autohome is "gaining share in auto ad budgets." Not only does the website — with content ranging from professional to user-generated to informational listings — make money from advertising, it's also growing sales in two other segments: auto finance and data products. Citi expects these newer areas to drive the "next leg of growth."
UBS maintained its sell rating in the wake of Autohome's quarterly report in early November, saying there's a "lack of visibility in (the) 2018 growth outlook."