Asset Klassen
Kurslisten
Hinweis zu Meine Suchen: Meine Suchen sind aufgrund der vielfachen Bitte aus der Community wieder unter Mein Portfolio zu finden.
Meistgeklickt









Hot News
Heiße Themen (24h)

| Geld/Brief | 4,01 $ / 4,75 $ |
| Spread | +18,45% |
| Schluss Vortag | 4,51 $ |
| Gehandelte Stücke | 1.223 |
| Tagesvolumen Vortag | 3.844,3 $ |
| Tagestief 4,51 $ Tageshoch 4,51 $ | |
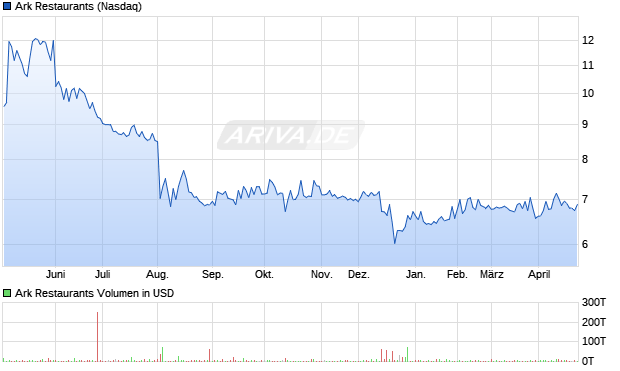
| 52W-Tief 4,33 $ 52W-Hoch 9,50 $ | |
| Jahrestief 4,33 $ Jahreshoch 9,50 $ | |
| Umsatz in Mio. | 165,75 $ |
| Operatives Ergebnis (EBIT) in Mio. | -3,43 $ |
| Jahresüberschuss in Mio. | -11,47 $ |
| Umsatz je Aktie | 45,97 $ |
| Gewinn je Aktie | -3,18 $ |
| Gewinnrendite | -6,92% |
| Umsatzrendite | -6,92% |
| Return on Investment | -8,59% |
| Marktkapitalisierung in Mio. | 16,16 $ |
| KGV (Kurs/Gewinn) | -2,24 |
| KBV (Kurs/Buchwert) | 0,78 |
| KUV (Kurs/Umsatz) | 0,15 |
| Eigenkapitalrendite | - |
| Eigenkapitalquote | +24,51% |
| Dividendenrendite 4,88% |
| Auszahlungen/Jahr 4 |
| Stabilität der Dividende 0,37 (max 1,00) |
| Jährlicher Dividendenzuwachs -2,84% (10 Jahre) |
| Datum | Dividende |
| 31.05.2024 | 0,19 $ |
| 28.02.2024 | 0,19 $ |
| 29.11.2023 | 0,19 $ |
| 30.08.2023 | 0,19 $ |
| 30.05.2023 | 0,19 $ |
| 27.02.2023 | 0,13 $ |
| 29.11.2022 | 0,13 $ |
| 30.08.2022 | 0,13 $ |

| Handelsplatz | Letzter | Änderung | Vortag | Zeit | |
|---|---|---|---|---|---|
| Nasdaq | 4,70 $ | +4,21% | 4,51 $ | 09.11.26 | |
| NYSE | 4,775 $ | - | - | 16.09.26 | |
| NYSE American | 6,88 $ | - | - | 16.09.25 | |
| Datum | Kurs | Volumen |
|---|---|---|
| 10.11.26 | 4,52 | - |
| 09.11.26 | 4,56 | 3.844 |
| 03.11.26 | 4,56 | 4.031 |
| 02.11.26 | 4,85 | 7.313 |
| 30.10.26 | 5,01 | 11.249 |
| Zeitraum | Kurs | % |
|---|---|---|
| 1 Woche | 4,56 $ | +3,07% |
| 1 Monat | 4,36 $ | +7,80% |
| 6 Monate | 6,60 $ | -28,79% |
| 1 Jahr | 7,10 $ | -33,80% |
| 5 Jahre | 16,61 $ | -71,70% |

| Marktkapitalisierung | 16,16 Mio. $ |
| Streubesitz | 29,17% |
| Währung | USD |
| Land | USA |
| Sektor | Zyklische Konsumgüter |
| Branche | Restaurant |
| Aktientyp | Stammaktie |
| +6,24% | CM Management, LLC |
| +2,90% | Dimensional Fund Advisors, Inc. |
| +2,60% | Nokomis Capital LLC |
| +2,33% | Vanguard Capital Management, LLC |
| +1,59% | Vanguard MStar Total Stk Mkt Idx Invest |
| +1,11% | Bridgeway Capital Management, LLC |
| +0,94% | DFA US Micro Cap I |
| +0,86% | First Manhattan Co. LLC |
| +0,67% | Renaissance Technologies Corp |
| +0,65% | EA Bridgeway Omni Small-Cap Value ETF |
| +0,65% | Empowered Funds, LLC |
| +0,51% | Geode Capital Management, LLC |
| +0,47% | DFA U.S. Small Cap I |
| +0,38% | Susquehanna International Group, LLP |
| +0,37% | Vanguard Fiduciary Trust Co |
| +0,33% | Dimensional US Targeted Value ETF |
| +0,29% | DFA U.S. Targeted Value I |
| +0,24% | Bridgeway Omni Small-Cap Value N |
| +0,2% | DFA U.S. Core Equity 2 Instl |
| +0,2% | Fidelity Extended Market Index |
| +0,18% | EA Bridgeway Ultra-Small Company Mkt ETF |
| +0,14% | Fidelity Total Market Index |
| +0,11% | DFA U.S. Core Equity 1 I |
| +0,1% | Dimensional US Small Cap ETF |
| +0,1% | BlackRock Inc |
| +0,08% | DFA U.S. Vector Equity I |
| +0,08% | DFA U.S. Small Cap Value I |
| +0,08% | Fidelity Series Total Market Index |
| +0,06% | Dimensional US Core Equity 2 ETF |
| +0,05% | Dimensional Global Trgtd Value USD Acc |
| +0,03% | Dimensional US Core Equity 1 ETF |
| +0,03% | Tower Research Capital LLC |
| +0,02% | JNL/DFA US Small Cap A |
| +0,02% | UBS Group AG |
| +0,02% | Northwestern Mutual Wealth Management Co |
| +0,01% | Acadian Asset Management LLC |
| - % | Concord Wealth Partners |
| - % | Larson Financial Group, LLC |
| - % | Barclays PLC |
| - % | Morgan Stanley - Brokerage Accounts |
| +18,876% | Institutionelle Aktionäre |
| +51,958% | Insider Aktionäre |
| +29,166% | Streubesitz |