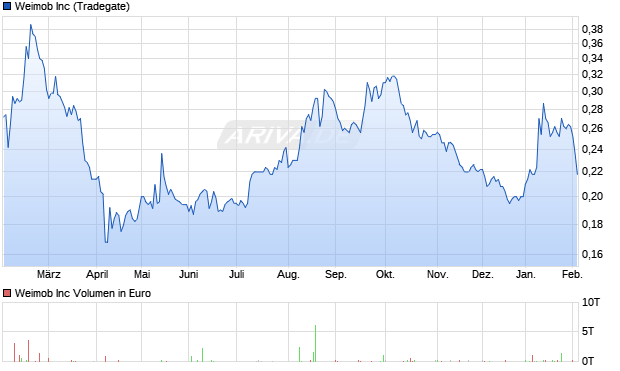
| Geld/Brief | 0,115 € / 0,139 € |
| Spread | +20,87% |
| Schluss Vortag | 0,127 € |
| Gehandelte Stücke | 0 |
| Tagesvolumen Vortag | - |
| Tagestief - Tageshoch - | |
| 52W-Tief - 52W-Hoch 0,32 € | |
| Jahrestief - Jahreshoch 0,298 € | |
| Umsatz in Mio. | 1.592 € |
| Operatives Ergebnis (EBIT) in Mio. | -7,06 € |
| Jahresüberschuss in Mio. | -221,50 € |
| Umsatz je Aktie | 0,40 € |
| Gewinn je Aktie | - |
| Gewinnrendite | -13,91% |
| Umsatzrendite | -13,91% |
| Return on Investment | -3,18% |
| Marktkapitalisierung in Mio. | 516,53 € |
| KGV (Kurs/Gewinn) | - |
| KBV (Kurs/Buchwert) | - |
| KUV (Kurs/Umsatz) | - |
| Eigenkapitalrendite | - |
| Eigenkapitalquote | +35,31% |

| Handelsplatz | Letzter | Änderung | Vortag | Zeit | |
|---|---|---|---|---|---|
| Düsseldorf | 0,114 € | 0 % | 0,114 € | 28.07.26 | |
| Frankfurt | 0,123 € | -1,60% | 0,125 € | 28.07.26 | |
| Gettex | 0,108 € | -21,17% | 0,137 € | 28.07.26 | |
| L&S RT | 0,1265 € | -0,78% | 0,1275 € | 28.07.26 | |
| München | 0,14 € | -0,71% | 0,141 € | 28.07.26 | |
| Quotrix | 0,126 € | -0,79% | 0,127 € | 28.07.26 | |
| Stuttgart | 0,115 € | 0 % | 0,115 € | 28.07.26 | |
| Tradegate | 0,142 € | +11,81% | 0,127 € | 23.07.26 | |
| Datum | Kurs | Volumen |
|---|---|---|
| 28.07.26 | 0,127 | 0 |
| 27.07.26 | 0,127 | 0 |
| 24.07.26 | 0,127 | 0 |
| 23.07.26 | 0,13 | 100 |
| 22.07.26 | 0,132 | 0 |
| Zeitraum | Kurs | % |
|---|---|---|
| 1 Woche | 0,132 € | +7,58% |
| 1 Monat | 0,129 € | +10,08% |
| 6 Monate | 0,264 € | -46,21% |
| 1 Jahr | 0,228 € | -37,72% |
| 5 Jahre | 1,19 € | -88,07% |
| Marktkapitalisierung | 516,53 Mio. € |
| Streubesitz | 90,29% |
| Währung | EUR |
| Land | Deutschland |
| Sektor | Technologie |
| Branche | Software |
| Aktientyp | Stammaktie |
| +16,29% | Institutionelle Aktionäre |
| +90,29% | Streubesitz |
| +74,00% | Individuelle Aktionäre |