Asset Klassen
Kurslisten
Hinweis zu Meine Suchen: Meine Suchen sind aufgrund der vielfachen Bitte aus der Community wieder unter Mein Portfolio zu finden.
Meistgeklickt









Hot News
Heiße Themen (24h)

| Geld/Brief | 99,00 € / 99,50 € |
| Spread | +0,51% |
| Schluss Vortag | 99,25 € |
| Gehandelte Stücke | 0 |
| Tagesvolumen Vortag | - |
| Tagestief 99,25 € Tageshoch 99,25 € | |
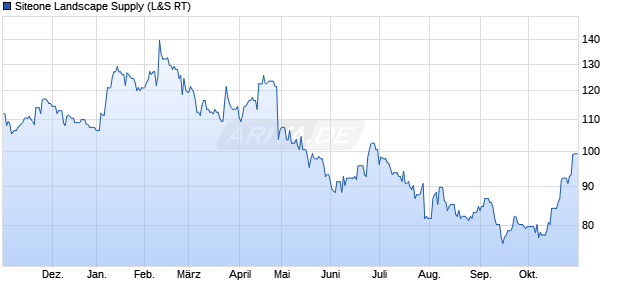
| 52W-Tief 56,75 € 52W-Hoch 141,50 € | |
| Jahrestief 56,75 € Jahreshoch 141,50 € | |
| Umsatz in Mio. | 4.705 $ |
| Operatives Ergebnis (EBIT) in Mio. | 238,10 $ |
| Jahresüberschuss in Mio. | 151,80 $ |
| Umsatz je Aktie | 105,44 $ |
| Gewinn je Aktie | 3,40 $ |
| Gewinnrendite | +3,23% |
| Umsatzrendite | +3,23% |
| Return on Investment | +4,71% |
| Marktkapitalisierung in Mio. | 4.504 $ |
| KGV (Kurs/Gewinn) | 36,64 |
| KBV (Kurs/Buchwert) | 3,35 |
| KUV (Kurs/Umsatz) | 1,18 |
| Eigenkapitalrendite | +9,15% |
| Eigenkapitalquote | +51,53% |
| Faktor-Zertifikate | 35 | |
| Knock-Outs | 18 |

| Handelsplatz | Letzter | Änderung | Vortag | Zeit | |
|---|---|---|---|---|---|
| Düsseldorf | 97,00 € | +6,59% | 91,00 € | 30.10.26 | |
| Frankfurt | 97,50 € | +3,17% | 94,50 € | 30.10.26 | |
| Gettex | 98,50 € | -0,51% | 99,00 € | 30.10.26 | |
| L&S RT | 99,25 € | 0 % | 99,25 € | 17:06 | |
| München | 96,50 € | +4,89% | 92,00 € | 30.10.26 | |
| Nasdaq | 110,60 $ | -0,04% | 110,64 $ | 30.10.26 | |
| NYSE | 110,87 $ | 0 % | 110,87 $ | 31.10.26 | |
| NYSE American | 110,67 $ | +0,57% | 110,04 $ | 30.10.26 | |
| Quotrix | 97,50 € | +4,28% | 93,50 € | 30.10.26 | |
| Stuttgart | 98,50 € | -0,51% | 99,00 € | 30.10.26 | |
| Tradegate BSX | 76,50 € | -22,73% | 99,00 € | 01.10.26 | |
| Xetra | 99,50 € | +1,53% | 98,00 € | 30.10.26 | |
| Datum | Kurs | Volumen |
|---|---|---|
| 01.11.26 | 99,25 | - |
| 31.10.26 | 99,25 | - |
| 30.10.26 | 99,25 | - |
| 29.10.26 | 99,00 | - |
| 28.10.26 | 93,25 | - |
| 27.10.26 | 92,75 | - |
| Zeitraum | Kurs | % |
|---|---|---|
| 1 Woche | 92,25 € | +7,59% |
| 1 Monat | 79,75 € | +24,45% |
| 6 Monate | 106,50 € | -6,81% |
| 1 Jahr | 112,00 € | -11,38% |
| 5 Jahre | 207,00 € | -52,05% |
| Marktkapitalisierung | 4,50 Mrd. $ |
| Streubesitz | -16,59% |
| Währung | USD |
| Land | USA |
| Sektor | Industrie |
| Branche | Industrieller Vertrieb |
| Aktientyp | Stammaktie |
| +10,25% | T. Rowe Price Associates, Inc. |
| +4,71% | 59 North Capital Management, LP |
| +4,69% | Kayne Anderson Rudnick Investment Management LLC |
| +4,65% | BAMCO Inc |
| +4,59% | Vanguard Capital Management, LLC |
| +4,43% | BlackRock Inc |
| +3,96% | Vanguard Portfolio Management, LLC |
| +3,79% | T. Rowe Price Investment Management,Inc. |
| +3,27% | American Funds SMALLCAP World A |
| +3,11% | Vanguard MStar Total Stk Mkt Idx Invest |
| +3,03% | T. Rowe Price New Horizons |
| +2,91% | Wasatch Advisors LP |
| +2,83% | AQR Capital Management LLC |
| +2,43% | Dimensional Fund Advisors, Inc. |
| +2,40% | Amundi |
| +2,27% | Capital World Investors |
| +2,25% | Vanguard Small Cap Index |
| +2,25% | Citadel Advisors Llc |
| +2,20% | Conestoga Capital Advisors, LLC |
| +1,92% | Impax Asset Management Group PLC |
| +1,82% | State Street Corp |
| +1,80% | T. Rowe Price Mid-Cap Value |
| +1,73% | Geode Capital Management, LLC |
| +1,66% | Baron Small Cap Retail |
| +1,63% | Neuberger Berman Group LLC |
| +1,44% | Qube Research & Technologies |
| +1,31% | Baron Real Estate Institutional |
| +1,25% | Vanguard MStar Small Cap Growth Indx Inv |
| +1,12% | T. Rowe Price US Smlr Coms Eq A |
| +1,06% | BNP Paribas Aqua C C |
| +1,06% | BNP Paribas Aqua I |
| +0,87% | Conestoga Small Cap Investors |
| +0,84% | KBI Water A GBP |
| +0,80% | Vanguard Explorer Inv |
| +0,72% | Janus Henderson Triton D |
| +0,71% | Amundi KBI Aqua C |
| +0,69% | Baron Discovery Institutional |
| +0,69% | Columbia Small Cap Growth Inst |
| +0,65% | Wasatch Core Growth |
| +0,64% | T. Rowe Price Small-Cap Stock |
| +114,753% | Institutionelle Aktionäre |
| +1,838% | Insider Aktionäre |
| -16,591% | Streubesitz |