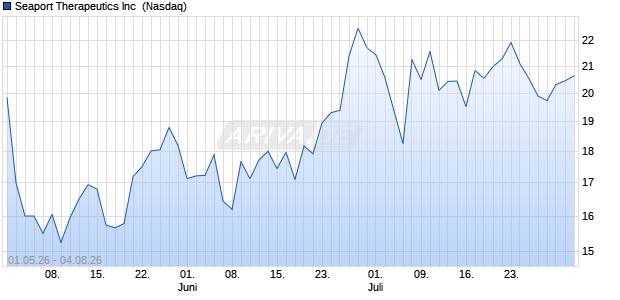
| Geld/Brief | 19,10 $ / 19,95 $ |
| Spread | +4,45% |
| Schluss Vortag | 20,44 $ |
| Gehandelte Stücke | 0 |
| Tagesvolumen Vortag | 146.435,4 $ |
| Tagestief - Tageshoch - | |
| 52W-Tief - 52W-Hoch 20,37 $ | |
| Jahrestief - Jahreshoch 20,37 $ | |
| Umsatz in Mio. | - |
| Operatives Ergebnis (EBIT) in Mio. | -87,29 $ |
| Jahresüberschuss in Mio. | -74,88 $ |
| Umsatz je Aktie | - |
| Gewinn je Aktie | - |
| Gewinnrendite | - |
| Umsatzrendite | - |
| Return on Investment | -30,07% |
| Marktkapitalisierung in Mio. | 1.058 $ |
| KGV (Kurs/Gewinn) | - |
| KBV (Kurs/Buchwert) | - |
| KUV (Kurs/Umsatz) | - |
| Eigenkapitalrendite | - |
| Eigenkapitalquote | -37,17% |

| Handelsplatz | Letzter | Änderung | Vortag | Zeit | |
|---|---|---|---|---|---|
| AMEX | 20,24 $ | 0 % | 20,24 $ | 14.07.26 | |
| Nasdaq | 20,37 $ | -0,34% | 20,44 $ | 15.07.26 | |
| NYSE | 20,31 $ | 0 % | 20,31 $ | 14.07.26 | |
| Datum | Kurs | Volumen |
|---|---|---|
| 15.07.26 | 20,45 | 146 T |
| 14.07.26 | 20,44 | 63 T |
| 13.07.26 | 20,10 | 113 T |
| 10.07.26 | 21,58 | 141 T |
| 09.07.26 | 20,51 | 303 T |
| Zeitraum | Kurs | % |
|---|---|---|
| 1 Woche | 20,51 $ | -0,68% |
| 1 Monat | 17,97 $ | +13,36% |
| 6 Monate | - | - |
| 1 Jahr | - | - |
| 5 Jahre | - | - |
| Marktkapitalisierung | 1,06 Mrd. $ |
| Streubesitz | 52,93% |
| Währung | USD |
| Land | USA |
| Sektor | Gesundheit |
| Branche | Biotechnologie |
| Aktientyp | Stammaktie |
| +4,38% | T. Rowe Price Health Sciences |
| +0,29% | Pier Capital Small Cap Growth Equity |
| +0,21% | abrdn Healthcare Investors |
| +0,21% | T. Rowe Price Health Sciences Port |
| +0,12% | SEB Nordamerikafond Småbolag |
| +0,10% | abrdn Life Sciences Investors |
| +0,01% | Principal SMA Small Cap Select Equity |
| +28,37% | Institutionelle Aktionäre |
| +52,93% | Streubesitz |
| +24,56% | Individuelle Aktionäre |