Asset Klassen
Kurslisten
Hinweis zu Meine Suchen: Meine Suchen sind aufgrund der vielfachen Bitte aus der Community wieder unter Mein Portfolio zu finden.
Meistgeklickt









Hot News
Heiße Themen (24h)

| Geld/Brief | 1,07 $ / 2,11 $ |
| Spread | +97,20% |
| Schluss Vortag | 1,69 $ |
| Gehandelte Stücke | 35.854 |
| Tagesvolumen Vortag | 27.245,67 $ |
| Tagestief 1,515 $ Tageshoch 1,69 $ | |
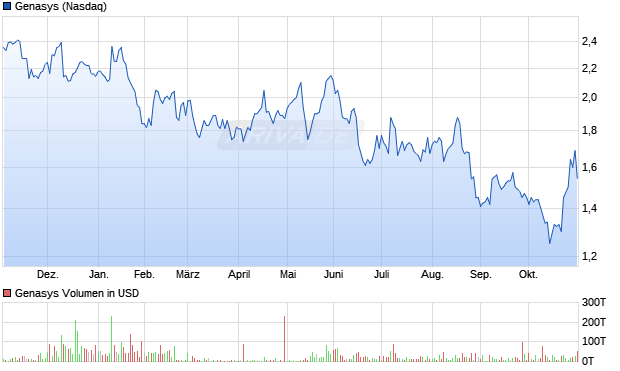
| 52W-Tief 1,17 $ 52W-Hoch 2,46 $ | |
| Jahrestief 1,17 $ Jahreshoch 2,39 $ | |
| Umsatz in Mio. | 40,76 $ |
| Operatives Ergebnis (EBIT) in Mio. | -16,42 $ |
| Jahresüberschuss in Mio. | -18,11 $ |
| Umsatz je Aktie | 0,90 $ |
| Gewinn je Aktie | -0,40 $ |
| Gewinnrendite | -44,44% |
| Umsatzrendite | -44,44% |
| Return on Investment | -28,36% |
| Marktkapitalisierung in Mio. | 68,31 $ |
| KGV (Kurs/Gewinn) | -6,10 |
| KBV (Kurs/Buchwert) | 48,80 |
| KUV (Kurs/Umsatz) | 2,71 |
| Eigenkapitalrendite | - |
| Eigenkapitalquote | +3,39% |

| Handelsplatz | Letzter | Änderung | Vortag | Zeit | |
|---|---|---|---|---|---|
| Düsseldorf | 1,37 € | +2,24% | 1,34 € | 30.10.26 | |
| Frankfurt | 1,40 € | -2,10% | 1,43 € | 30.10.26 | |
| Gettex | 1,40 € | -6,67% | 1,50 € | 30.10.26 | |
| L&S RT | 1,38 € | 0 % | 1,38 € | 19:02 | |
| München | 1,39 € | 0 % | 1,39 € | 30.10.26 | |
| Nasdaq | 1,545 $ | -8,58% | 1,69 $ | 30.10.26 | |
| NYSE | 1,535 $ | -8,08% | 1,67 $ | 30.10.26 | |
| NYSE American | 1,65 $ | - | - | 29.10.26 | |
| Quotrix | 1,52 € | +5,56% | 1,44 € | 30.10.26 | |
| Stuttgart | 1,35 € | -8,78% | 1,48 € | 30.10.26 | |
| Datum | Kurs | Volumen |
|---|---|---|
| 30.10.26 | 1,54 | 49.298 |
| 29.10.26 | 1,69 | 27.246 |
| 28.10.26 | 1,60 | 21.966 |
| 27.10.26 | 1,64 | 13.482 |
| 26.10.26 | 1,50 | 2.617 |
| Zeitraum | Kurs | % |
|---|---|---|
| 1 Woche | 1,475 $ | +4,75% |
| 1 Monat | 1,45 $ | +6,55% |
| 6 Monate | 1,87 $ | -17,38% |
| 1 Jahr | 2,36 $ | -34,53% |
| 5 Jahre | 5,08 $ | -69,59% |

| Marktkapitalisierung | 68,31 Mio. $ |
| Streubesitz | 35,17% |
| Währung | USD |
| Land | USA |
| Sektor | Technologie |
| Branche | Wissenschaftliche & technische Geräte |
| Aktientyp | Stammaktie |
| +12,41% | Awm Investment Company Inc |
| +4,00% | Vanguard Capital Management, LLC |
| +3,16% | Pacific Ridge Capital Partners, LLC |
| +2,86% | Vanguard MStar Total Stk Mkt Idx Invest |
| +2,74% | Susquehanna International Group, LLP |
| +2,52% | FNY Investment Advisers, LLC |
| +2,30% | AlphaCore Capital LLC |
| +2,20% | Manatuck Hill Partners LLC |
| +1,54% | BlackRock Inc |
| +1,25% | Adara Smaller Companies |
| +1,21% | Sequoia Financial Advisors LLC |
| +1,10% | Geode Capital Management, LLC |
| +0,92% | Herald Ord |
| +0,70% | Citadel Advisors Llc |
| +0,66% | Prospera Financial Services Inc |
| +0,64% | Evernest Financial Advisors LLC |
| +0,60% | Vanguard Fiduciary Trust Co |
| +0,50% | Fidelity Extended Market Index |
| +0,4% | Bank of Oklahoma National Association |
| +0,35% | State Street Corp |
| +0,3% | iShares Micro-Cap ETF |
| +0,28% | Aristides Capital LLC |
| +0,24% | Renaissance Technologies Corp |
| +0,22% | Northern Trust Corp |
| +0,21% | The Goldman Sachs Group Inc |
| +0,18% | Fidelity Total Market Index |
| +0,14% | Fidelity Series Total Market Index |
| +0,06% | Vanguard Balanced Index Inv |
| +0,06% | Fidelity Nasdaq Composite Index |
| +0,05% | Vanguard U.S. Eq Idx £ Acc |
| +0,02% | 1290 VT Micro Cap K |
| +57,671% | Institutionelle Aktionäre |
| +7,163% | Insider Aktionäre |
| +35,166% | Streubesitz |