Asset Klassen
Kurslisten
Hinweis zu Meine Suchen: Meine Suchen sind aufgrund der vielfachen Bitte aus der Community wieder unter Mein Portfolio zu finden.
Meistgeklickt









Hot News
Heiße Themen (24h)

| Geld/Brief | - / - |
| Spread | - |
| Schluss Vortag | 2,47 $ |
| Gehandelte Stücke | 100 |
| Tagesvolumen Vortag | 247,00 $ |
| Tagestief 2,01 $ Tageshoch 2,01 $ | |
| 52W-Tief - 52W-Hoch 2,01 $ | |
| Jahrestief - Jahreshoch 2,01 $ | |
| Umsatz in Mio. | 209,33 $ |
| Operatives Ergebnis (EBIT) in Mio. | 451,55 $ |
| Jahresüberschuss in Mio. | 408,40 $ |
| Umsatz je Aktie | 0,28 $ |
| Gewinn je Aktie | 0,55 $ |
| Gewinnrendite | +195,10% |
| Umsatzrendite | +195,10% |
| Return on Investment | +9,64% |
| Marktkapitalisierung in Mio. | 2.788 $ |
| KGV (Kurs/Gewinn) | 6,85 |
| KBV (Kurs/Buchwert) | 0,83 |
| KUV (Kurs/Umsatz) | 13,45 |
| Eigenkapitalrendite | +12,14% |
| Eigenkapitalquote | +79,42% |
| Dividendenrendite 4,96% |
| Auszahlungen/Jahr 2 |
| Gesteigert seit 2 Jahren |
| Keine Senkung seit 6 Jahren |
| Stabilität der Dividende 0,85 (max 1,00) |
| Jährlicher 1,23% (5 Jahre) Dividendenzuwachs 1,48% (10 Jahre) |
| Ausschüttungs- 35,23% (auf den Gewinn/FFO) quote % (auf den Free Cash Flow) |
| Erwartete Dividendensteigerung -1,95% |
| Datum | Dividende |
| 29.06.2026 | 0,098 AUD |
| 30.12.2025 | 0,096 AUD |
| 30.12.2024 | 0,092 AUD |
| 29.06.2023 | 0,093 AUD |
| 29.12.2022 | 0,090 AUD |
| 29.06.2022 | 0,093 AUD |
| 29.06.2021 | 0,090 AUD |
| 30.12.2020 | 0,090 AUD |

| Handelsplatz | Letzter | Änderung | Vortag | Zeit | |
|---|---|---|---|---|---|
| Düsseldorf | 2,253 € | +1,81% | 2,213 € | 30.10.26 | |
| Frankfurt | 2,2375 € | +0,88% | 2,218 € | 30.10.26 | |
| Hamburg | 2,21 € | 0 % | 2,21 € | 30.10.26 | |
| Hannover | 2,21 € | 0 % | 2,21 € | 30.10.26 | |
| L&S RT | 2,2705 € | 0 % | 2,2705 € | 01.11.26 | |
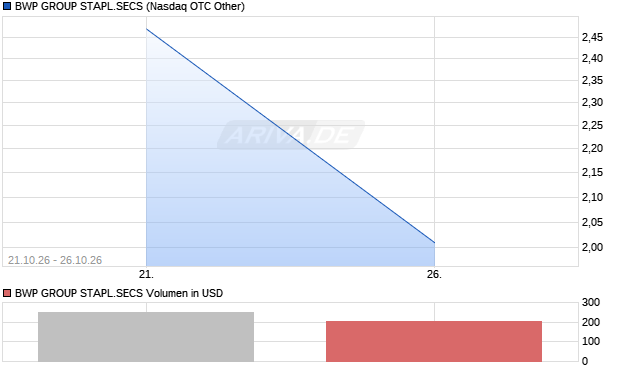
| Nasdaq OTC Other | 2,01 $ | -18,62% | 2,47 $ | 26.10.26 | |
| Quotrix | 2,26 € | 0 % | 2,26 € | 30.10.26 | |
| Tradegate BSX | 2,16 € | -5,26% | 2,28 € | 29.09.26 | |
| Datum | Kurs | Volumen |
|---|---|---|
| 26.10.26 | 2,01 | 201 |
| 21.10.26 | 2,47 | 247 |
| 22.10.21 | 3,10 | 3.100 |
| Zeitraum | Kurs | % |
|---|---|---|
| 1 Woche | 2,47 $ | -18,62% |
| 1 Monat | 2,47 $ | -18,62% |
| 6 Monate | 2,47 $ | -18,62% |
| 1 Jahr | - | - |
| 5 Jahre | - | - |
| Marktkapitalisierung | 2,79 Mrd. $ |
| Streubesitz | 48,21% |
| Währung | AUD |
| Land | Australien |
| Sektor | Immobilien |
| Branche | Industrieimmobilien |
| Aktientyp | Stammaktie |
| +1,18% | Vanguard International Stock Index-Total Intl Stock Indx |
| +0,85% | DFA Investment Dimensions-DFA Int'l Real Estate Securities |
| +0,48% | Vanguard Tax Managed Fund-Vanguard Developed Markets Index Fund |
| +0,42% | iShares Core MSCI EAFE ETF |
| +0,39% | Vanguard Global ex U.S. Real Estate Index Fund |
| +0,34% | iShares MSCI EAFE Small Cap ETF |
| +0,28% | SPDR Portfolio Developed World ex-US ETF |
| +0,2% | Goldman Sachs International Small Cap Insights Fund |
| +0,19% | Vanguard Intl Equity Index Fds-FTSE All World ex U.S.Small Cap Index |
| +0,16% | College Retirement Equities Fund-Stock Account |
| +27,684% | Institutionelle Aktionäre |
| +24,103% | Insider Aktionäre |
| +48,213% | Streubesitz |