Werden Sie mit Ihrer Handelsstrategie der Trader 2026 und gewinnen Sie einen Range Rover Evoque. Hier anmelden!
| Geld/Brief | 0,106 € / 0,125 € |
| Spread | +17,92% |
| Schluss Vortag | 0,111 € |
| Gehandelte Stücke | 0 |
| Tagesvolumen Vortag | 888,00 € |
| Tagestief 0,105 € Tageshoch 0,112 € | |
| 52W-Tief 0,087 € 52W-Hoch 0,166 € | |
| Jahrestief 0,087 € Jahreshoch 0,166 € | |
| Umsatz in Mio. | - |
| Operatives Ergebnis (EBIT) in Mio. | -1,53 GBX |
| Jahresüberschuss in Mio. | -1,42 GBX |
| Umsatz je Aktie | - |
| Gewinn je Aktie | 0,00 GBX |
| Gewinnrendite | - |
| Umsatzrendite | - |
| Return on Investment | -0,47% |
| Marktkapitalisierung in Mio. | 89,08 GBX |
| KGV (Kurs/Gewinn) | -69,10 |
| KBV (Kurs/Buchwert) | 0,41 |
| KUV (Kurs/Umsatz) | - |
| Eigenkapitalrendite | - |
| Eigenkapitalquote | +99,61% |

| Handelsplatz | Letzter | Änderung | Vortag | Zeit | |
|---|---|---|---|---|---|
| Frankfurt | 0,11 € | +1,85% | 0,108 € | 08:04 | |
| L&S RT | 0,117 € | -1,68% | 0,119 € | 11:02 | |
| Nasdaq OTC Other | 0,1 $ | -50,00% | 0,2 $ | 09.09.26 | |
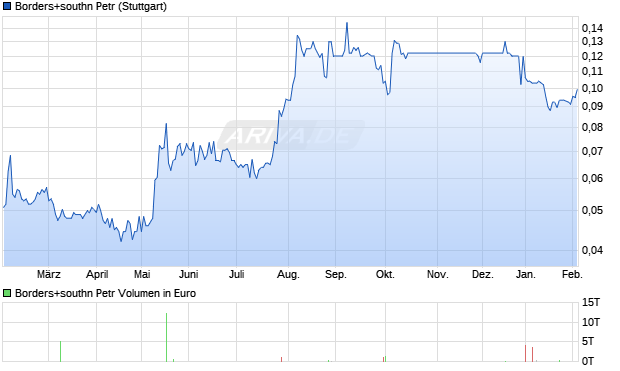
| Stuttgart | 0,109 € | -1,80% | 0,111 € | 10:47 | |
| Datum | Kurs | Volumen |
|---|---|---|
| 09.09.26 | 0,111 | 888 |
| 08.09.26 | 0,112 | 1.845 |
| 07.09.26 | 0,116 | 0 |
| 04.09.26 | 0,113 | 0 |
| 03.09.26 | 0,12 | 0 |
| Zeitraum | Kurs | % |
|---|---|---|
| 1 Woche | 0,125 € | -11,20% |
| 1 Monat | 0,121 € | -8,26% |
| 6 Monate | 0,111 € | 0,00% |
| 1 Jahr | 0,122 € | -9,02% |
| 5 Jahre | 0,004 € | +2.675,00% |
| Marktkapitalisierung | 89,08 Mio. GBX |
| Streubesitz | 45,21% |
| Währung | GBX |
| Land | Großbritannien |
| Sektor | Energie |
| Branche | Öl & Gas Exploration & Produktion |
| Aktientyp | Stammaktie |
| +7,89% | Institutionelle Aktionäre |
| +46,901% | Insider Aktionäre |
| +45,209% | Streubesitz |