Air Lease Corporation ist ein global agierender weniger von Verkehrsflugzeugen mit Fokus auf junge, treibstoffeffiziente Jets führender Hersteller. Das Unternehmen mit Sitz in Los Angeles strukturiert langfristige Leasingverträge mit Airlines weltweit und positioniert sich als kapitalmarktorientierte Plattform zwischen Flugzeugherstellern und Fluggesellschaften. Für institutionelle und private Anleger fungiert Air Lease als Vehikel, um indirekt am strukturellen Wachstum des weltweiten Luftverkehrs und an der steigenden Nachfrage nach Operating-Leasing zu partizipieren, ohne selbst Airline-Risiken wie operatives Tagesgeschäft oder Markenführung zu tragen.
Geschäftsmodell und Erlösquellen
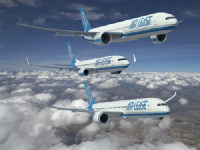
Air Lease betreibt ein klassisches Operating-Leasing-Modell für Verkehrsflugzeuge. Der Konzern erwirbt überwiegend neue oder nahezu neue Maschinen direkt bei Herstellern wie Airbus und Boeing, finanziert diese mittels Eigenkapital, Anleihen und Kreditlinien und vermietet sie anschließend im Rahmen von mehrjährigen Leasingverträgen an Fluggesellschaften in verschiedenen Regionen. Die wesentlichen Erlösquellen sind feste Leasingraten, die über die Vertragslaufzeit planbare Cashflows generieren, sowie potenzielle Veräußerungsgewinne durch den späteren Verkauf oder das Übergangsleasing der Flugzeuge im Sekundärmarkt. Typischerweise strebt Air Lease eine hohe Auslastung der Flotte und eine breite Streuung über Airlines, Regionen und Flugzeugtypen an, um das Kredit- und Restwertrisiko zu diversifizieren. Die Kapitalintensität des Geschäfts bedingt einen strukturell hohen Verschuldungsgrad, der durch langfristige Refinanzierung und ein aktives Liability-Management gesteuert wird.
Mission und strategische Zielsetzung
Die Mission von Air Lease besteht darin, Fluggesellschaften weltweit mit moderner, effizienter und flexibel einsetzbarer Flottenkapazität zu versorgen und ihnen damit eine kapitalleichtere Bilanzstruktur zu ermöglichen. Das Management versteht den Konzern als langfristigen Partner von Airlines und Herstellern, der Versorgungssicherheit mit neuen Flugzeugen, Finanzierungs-Know-how und Flottenexpertise bündelt. Im Zentrum steht die Bereitstellung einer modernen, emissionsärmeren Flotte, die den Treibstoffverbrauch, die Betriebskosten und den CO₂-Fußabdruck der Kunden reduziert. Langfristig zielt Air Lease auf ein profitables, risikojustiertes Wachstum der Flotte, eine weitere Globalisierung der Kundenbasis und die Stärkung seiner Rolle als bevorzugter Abnehmer von Neuflugzeugen bei den Herstellern.
Produkte, Dienstleistungen und Leasingstrukturen
Das Kernprodukt von Air Lease ist das mittel- bis langfristige Operating-Leasing einzelner Flugzeuge oder Flottenpakete. Die Verträge umfassen typischerweise Laufzeiten von mehreren Jahren und schließen Wartungs- und Rückgabebestimmungen ein, die den technischen Zustand und den Restwert des Flugzeugs sichern sollen. Neben Standard-Leasingverträgen bietet Air Lease ergänzende Dienstleistungen, darunter:
- Strukturierung maßgeschneiderter Leasingprofile in Bezug auf Laufzeit, Ratenhöhe und Restwertannahmen
- Flottenberatung bei der Auswahl geeigneter Flugzeugtypen und Sitzkonfigurationen
- Übergangsleasing für Airlines bei kurzfristigem Kapazitätsbedarf
- Remarketing und Umlenkung von Flugzeugen an neue Kunden im Falle von Vertragsende oder Ausfall
Darüber hinaus kann Air Lease im Rahmen von Sale-and-Lease-back-Transaktionen Flugzeuge aus den Bilanzen von Airlines kaufen und unmittelbar zurückvermieten. Diese Struktur hilft Fluggesellschaften, Liquidität freizusetzen und Kapitalbindungen zu reduzieren, während Air Lease seine Flotte mit bereits eingesetzten, marktgängigen Mustern erweitert.
Business Units und operative Struktur
Air Lease berichtet operativ vor allem entlang der Vermietung seiner Flugzeugflotte und von zugehörigen Finanzierungslösungen. Das Geschäftsmodell ist funktional, nicht stark in rechtlich getrennte Geschäftseinheiten mit unterschiedlichen Segmentberichten ausdifferenziert. Gleichwohl lassen sich mehrere Aktivitätsbereiche unterscheiden:
- Neuflugzeugbestellungen und Beschaffungsmanagement bei Airbus, Boeing und anderen Herstellern
- Primary Leasing: Erstplatzierung neuer Flugzeuge bei Airlines mit langfristigen Verträgen
- Secondary Leasing und Remarketing: Anschlussplatzierung von Flugzeugen nach Ablauf der ersten Laufzeit
- Portfoliomanagement und Asset-Verkäufe im Sekundärmarkt
- Finanzierung und Kapitalmarktaktivitäten zur Sicherstellung langfristiger Liquidität
Diese Funktionen werden zentral gesteuert, was Skaleneffekte bei Verhandlungen mit Herstellern, Banken und Investoren ermöglicht.
Alleinstellungsmerkmale und Wettbewerbsvorteile
Ein zentrales Alleinstellungsmerkmal von Air Lease ist der fokussierte Ausbau eines jungen, homogenen Flugzeugportfolios mit Schwerpunkt auf schmalrumpfingen und breitrumpfigen Jets neuer Generation. Dadurch ergibt sich ein Profil mit vergleichsweise niedrigem Durchschnittsalter der Flotte, was für viele Airlines angesichts von Effizienz- und Klimazielen attraktiv ist. Air Lease verfügt über langjährige, persönliche Beziehungen zu Entscheidungsträgern bei Flugzeugherstellern und Fluggesellschaften, die bei der Aushandlung großer Bestellvolumina, Lieferpositionen und Konditionen vorteilhaft sind. Hinzu kommt ein erfahrenes Managementteam mit tiefem Zyklusverständnis der Luftfahrtbranche und jahrzehntelanger Leasingexpertise. Die Fähigkeit, unterschiedliche Finanzierungsinstrumente am Kapitalmarkt zu kombinieren, etwa unbesicherte Anleihen, revolvierende Kreditfazilitäten und Asset-basierte Strukturen, verschafft dem Unternehmen Flexibilität bei der Steuerung von Zins- und Refinanzierungsrisiken.
Burggräben und strukturelle Moats
Die Branche des Flugzeugleasings weist mehrere Eintrittsbarrieren auf, von denen Air Lease profitiert. Erstens handelt es sich um ein stark kapitalintensives Geschäft mit hohen Mindestvolumina bei Flugzeugbestellungen. Der Zugang zu günstiger, langfristiger Refinanzierung stellt einen wesentlichen Burggraben dar, der institutionellen Akteuren mit etabliertem Rating Vorteile verschafft. Zweitens erfordert die verlässliche Bewertung von Restwerten und Lebenszyklusrisiken der Flugzeuge eine ausgeprägte Datenbasis sowie technisches Know-how, was die Gefahr von Fehleinschätzungen bei Neueinsteigern erhöht. Drittens sind Lieferpositionen bei Herstellern knapp und werden bevorzugt an langjährige Großkunden mit verlässlicher Abnahmehistorie vergeben. Air Lease kann hier auf ein signifikantes Orderbuch und eine Historie als verlässlicher Abnehmer verweisen, was als Moat gegenüber kleineren Wettbewerbern wirkt. Zudem stärkt die Diversifikation über viele Airlines, Regionen und Flugzeugtypen hinweg die Resilienz gegenüber lokalen Nachfrageschocks, regulatorischen Eingriffen oder Nachfrageverschiebungen.
Wettbewerbsumfeld und wesentliche Konkurrenten
Air Lease operiert in einem globalen, kompetitiven Markt für kommerzielles Flugzeugleasing. Zu den wesentlichen Wettbewerbern zählen große, teils staatsnahe Leasinggesellschaften sowie Finanzinvestoren mit spezialisierten Luftfahrtplattformen. Dominierende Marktteilnehmer sind unter anderem Avolon, SMBC Aviation Capital, BOC Aviation, Aviation Capital Group und andere internationale Lessors. Zusätzlich konkurriert Air Lease indirekt mit Finanzierungsangeboten von Banken, Exportkreditagenturen und Herstellerfinanzierungstöchtern. Der Wettbewerb erfolgt primär über Leasingkonditionen, Verfügbarkeit moderner Flugzeuge, Servicequalität und die Fähigkeit, komplexe Flottenprogramme über den gesamten Lebenszyklus zu begleiten. Gleichwohl herrscht eine gewisse Marktdisziplin, da langfristige Kapitalbindung und Restwertrisiken aggressiven Preiswettbewerb begrenzen können.
Management, Governance und Strategie
Das Management von Air Lease wird von Branchenveteranen geprägt, die den kommerziellen Flugzeugleasingmarkt seit Jahrzehnten mitentwickelt haben. Die Unternehmensführung verfolgt eine Strategie, die auf disziplinierte Flottenexpansion, starke Kundenbeziehungen und konservatives Risikomanagement abzielt. Kernelemente der Strategie sind:
- Fokus auf moderne, treibstoffeffiziente Flugzeugtypen mit breiter Nachfragebasis
- Aufbau eines diversifizierten Kundenportfolios über unterschiedliche Geschäftsmodelle (Low-Cost, Netzwerkcarrier, regionale Airlines)
- Konservatives Kreditrisikomanagement mit sorgfältiger Analyse der Bonität von Airlines
- Laufende Optimierung der Laufzeitenstruktur von Aktiva und Passiva zur Begrenzung von Zins- und Refinanzierungsrisiken
- Aktives Portfoliomanagement durch selektive Verkäufe und Neuallokation von Kapital in attraktivere Flugzeugtypen
Die Corporate Governance orientiert sich an US-amerikanischen Kapitalmarktstandards mit einem Board of Directors, Ausschüssen für Audit, Vergütung und Risiko sowie Transparenzanforderungen der Börsennotierung.
Branchen- und Regionalanalyse
Air Lease ist im globalen Luftfahrtfinanzierungsmarkt tätig, der eng mit der Entwicklung des Passagier- und Frachtflugverkehrs verknüpft ist. Langfristig wird die Branche durch steigende Einkommen, Urbanisierung und die wachsende Mittelschicht in Schwellenländern gestützt, was die Nachfrage nach Flugreisen erhöht. Die Leasingquote, also der Anteil geleaster Flugzeuge an der weltweiten Flotte, ist über Jahre gestiegen, da Airlines Bilanzflexibilität und geringere Kapitalkosten schätzen. Regional ist Air Lease breit diversifiziert und bedient Fluggesellschaften in Nordamerika, Europa, Asien-Pazifik, dem Nahen Osten und Lateinamerika. Diese geografische Streuung schützt teilweise vor zyklischen Schwankungen einzelner Märkte, erhöht aber die Exponierung gegenüber unterschiedlichen regulatorischen Regimen, Währungsrisiken und politischen Rahmenbedingungen. Die Branche bleibt zyklisch und sensibel für Konjunkturabschwünge, Ölpreisschwankungen, geopolitische Ereignisse und Pandemierisiken, die Passagieraufkommen und damit die Zahlungsfähigkeit von Airlines beeinflussen.
Unternehmensgeschichte und Entwicklung
Air Lease wurde nach der Finanzkrise gegründet, als zahlreiche Airlines und Banken ihre Bilanzen neu ausrichteten und der Bedarf an alternativen Finanzierungsquellen für Flugzeuge stieg. Das Gründungsteam bestand aus erfahrenen Leasingmanagern, die bereits zuvor große Plattformen im Flugzeugleasing aufgebaut hatten. Von Beginn an setzte das Unternehmen auf ein klares Profil: Aufbau eines Portfolios moderner, vorwiegend werthaltiger Flugzeugmuster mit globaler Einsetzbarkeit und hoher Liquidität im Sekundärmarkt. Mit der Zeit etablierte sich Air Lease als wichtiger Kunde der großen Flugzeughersteller, platzierte umfangreiche Flugzeugbestellungen und weitete seine Kundenbasis auf zahlreiche Airlines unterschiedlicher Geschäftsmodelle aus. Die Notierung an der US-Börse ermöglichte den Zugang zu institutionellem Kapital und stärkte die Fähigkeit, die Flottenexpansion über den Kapitalmarkt zu finanzieren. Krisenphasen in der Luftfahrt, einschließlich starker Nachfragerückgänge, führten zeitweise zu erhöhten Ausfallrisiken und Umstrukturierungen einzelner Kundenverträge, boten jedoch zugleich Chancen, günstig Flugzeuge zu platzieren oder bestehende Portfolios anzupassen.
Besonderheiten des Geschäftsmodells und Risikoprofil
Eine Besonderheit von Air Lease ist die deutliche Ausrichtung auf Operating-Leasing mit vergleichsweise geringer technischer Instandhaltungsverantwortung im Vergleich zu integrierten Airline-Strukturen. Das Unternehmen konzentriert sich auf Flugzeuge mit breiter Marktakzeptanz, um im Fall von Zahlungsschwierigkeiten einzelner Kunden alternative Abnehmer zu finden. Der Cashflow ist vergleichsweise planbar, weil langfristige Leasingverträge mit festen Raten dominieren. Gleichzeitig besteht eine hohe Abhängigkeit von funktionierenden Luftverkehrsmärkten, zugänglichen Kapitalmärkten und stabilen Herstellern. Wechselkursrisiken, Zinsvolatilität, geopolitische Spannungen und regulatorische Eingriffe in den Luftverkehr wirken sich indirekt auf das Geschäftsmodell aus. Technologische Entwicklungen, etwa neue, noch effizientere Flugzeugtypen oder alternative Antriebstechnologien, können den Restwert älterer Flugzeuge beeinträchtigen und verlangen kontinuierliches Portfoliomanagement.
Chancen aus Sicht konservativer Anleger
Für konservativ orientierte Investoren bietet Air Lease mehrere potenzielle Chancen. Erstens ermöglicht das Geschäftsmodell eine Beteiligung am globalen Luftverkehrswachstum, ohne direkt in Airlines mit oftmals fragilen Bilanzen zu investieren. Zweitens schaffen langfristige Leasingverträge mit bonitätsstarken Kunden eine gewisse Cashflow-Visibilität über mehrere Jahre. Drittens kann die Spezialisierung auf junge, treibstoffeffiziente Flugzeuge die Attraktivität des Portfolios erhöhen, da Airlines unter Kosten- und Emissionsdruck stehen und ältere Flotten ausmustern. Viertens eröffnet der Zugang zu internationalen Kapitalmärkten die Möglichkeit, von unterschiedlichen Zinsniveaus und Investorenbasen zu profitieren. Schließlich kann die zyklische Natur der Branche für langfristige Anleger attraktive Einstiegszeitpunkte in Phasen vorübergehender Marktverwerfungen bieten, sofern die Bilanzstruktur robust bleibt und das Risikomanagement funktioniert.
Risiken und zentrale Unsicherheiten
Demgegenüber stehen substanzielle Risiken, die konservative Anleger berücksichtigen müssen. Das Geschäftsmodell ist stark verschuldungsbasiert, wodurch Zinsänderungen, Refinanzierungsbedingungen und das Vertrauen der Kapitalmärkte eine zentrale Rolle spielen. In Phasen kräftig steigender Zinsen oder eingeschränkter Marktliquidität können Refinanzierungskosten deutlich anziehen. Zudem ist das Kreditrisiko der Airline-Kunden nicht eliminierbar. Insolvenzen, Restrukturierungen oder staatliche Eingriffe können zu Zahlungsstörungen, Leasingneuvereinbarungen oder Flugzeugrücknahmen führen. Restwertrisiken stellen eine weitere Unsicherheit dar: Technologische Sprünge, Veränderungen der Nachfrage nach bestimmten Flugzeugtypen oder regulatorische Vorgaben zu Emissionen können den Wiederverkaufswert der Flotte beeinträchtigen. Hinzu kommen exogene Schocks wie Pandemien, politische Konflikte oder Sicherheitsereignisse, die den globalen Luftverkehr abrupt einbrechen lassen können. Für konservative Anleger bedeutet dies, dass ein Investment in Air Lease trotz der Diversifikation und der etablierten Marktstellung klar dem zyklischen Segment der Luftfahrtfinanzierung zuzurechnen ist und sorgfältig in das Gesamtportfolio eingebettet werden sollte, ohne dass daraus eine Anlageempfehlung abgeleitet werden kann.