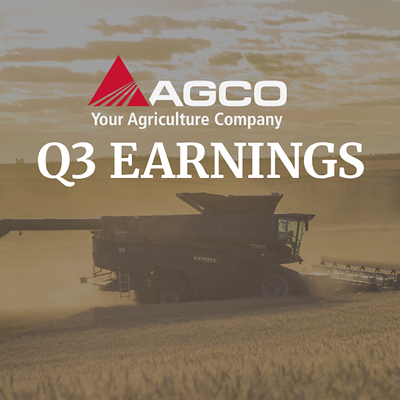
Hansotia continued, "Lower farm income and uncertainty across global agricultural markets continued to weigh on farmer sentiment, with conditions softening further in EME and Latin America. We remain focused on what we can control: helping farmers improve their economics while strengthening our cost structure. Our fuel-efficient tractors, AI-enabled targeted spraying systems and autonomous solutions are designed to lower operating costs and improve returns for farmers. These actions are helping us navigate current conditions and position AGCO for the recovery."
Net sales for the first nine months of 2026 were approximately $7.2 billion, an increase of 0.7% compared to the same period in 2025. For the first nine months of 2026, reported net income was $2.59 per share and adjusted net income(1) was $3.42 per share. These results compare to reported net income of $8.45 per share and adjusted net income(1) of $3.11 per share for the same period in 2025. Excluding favorable foreign currency translation of 3.4%, net sales in the first nine months of 2026 decreased 2.7% compared to the same period in 2025.
Third Quarter Highlights
- Reported regional sales results(2): Europe/Middle East ("EME") (19.1)%, North America +34.8%, Latin America ("LATAM") (15.4)%, Asia/Pacific/Africa ("APA") +13.8%
- Constant currency regional sales results(1)(2)(3): EME (18.1)%, North America +35.1%, LATAM (19.1)%, APA +9.2%
- Regional operating margin performance: EME 10.5%, North America 2.8%, LATAM 2.5%, APA 13.9%
Hansotia concluded, "The long-term fundamentals supporting global agriculture remain intact, driven by rising food demand and the need for greater on-farm productivity. Through PTx, farmers can add automation, autonomy and other advanced capabilities to existing equipment across virtually any brand, gaining the benefits of the latest technology without purchasing an entirely new machine. Together with our premium equipment brands, this differentiated strategy positions AGCO to create value through the cycle and capture growth as market conditions improve."
Market Update
Prior Year Period
Prior Year Period
North American industry retail tractor sales were 9% lower in the first nine months of 2026 compared to the same period in 2025 with the largest change occurring in higher-horsepower categories. Combine unit sales were 10% lower year-over-year during the same period. Commodity prices and evolving conditions surrounding trade and export demand continued to influence farm profitability. As a result, farmers remained cautious with spending, and industry demand is expected to remain below historical mid-cycle levels through the remainder of 2026.
Brazil industry retail tractor sales were 17% lower in the first nine months of 2026 compared to the same period in 2025 reflecting reduced demand for larger equipment. Farm profitability remained under pressure due to higher interest rates, constrained credit conditions and soft farm economics. Broader economic and policy uncertainty weighed on farmer confidence and led to delayed equipment purchases.
Western Europe industry retail tractor sales were 1% lower during the first nine months of 2026 compared to the same period in 2025 with the third quarter down 9% compared to the third quarter of 2025. Spain, Germany, France and Italy showed the largest third quarter declines. Hot and dry weather across portions of Western Europe created yield variability and weighed on farmer sentiment in the third quarter. While relatively healthy livestock and dairy economics and an aging equipment fleet continue to support replacement demand, softer crop economics, elevated input costs and economic developments have constrained equipment purchasing activity. As a result, industry demand is expected to remain challenged for the remainder of 2026.
Regional Results
AGCO Regional Net Sales (in millions)
North America
North American region net sales increased 35.1% during the third quarter of 2026 compared to the third quarter of 2025, excluding the impact of unfavorable currency translation. Higher unit sales across most equipment categories, particularly high-horsepower and mid-range tractors and parts, supported the increase in sales. Income from operations for the third quarter of 2026 was $13.8 million compared to a loss from operations of $42.0 million in the same period in 2025, primarily due to higher sales and production volumes and the benefit of approximately $13.0 million of certain IEEPA tariff refunds recognized during the period.
Latin America
Net sales in the Latin America region decreased 19.1% during the third quarter of 2026 compared to the third quarter of 2025, excluding the impact of favorable currency translation. Softer industry demand resulted in lower sales. Income from operations for the third quarter of 2026 was $13.0 million lower compared to the same period in 2025. This decrease was primarily the result of significantly lower sales and production volumes.
Europe/Middle East
Net sales in the Europe/Middle East region decreased 18.1% during the third quarter of 2026 compared to the third quarter of 2025, excluding the impact of unfavorable currency translation. Sales declines were primarily driven by weaker industry demand, with the most pronounced decreases in Germany, France, Italy and Spain. Income from operations in the third quarter of 2026 was $115.1 million lower compared to the same period in 2025, primarily due to significantly lower sales and production levels.
Asia/Pacific/Africa
Asia/Pacific/Africa region net sales increased 9.2% during the third quarter of 2026 compared to the third quarter of 2025, excluding favorable currency translation impacts. Higher sales in Australia were partially offset by lower sales across many of the Asian and African markets. Income from operations in the third quarter of 2026 was $17.2 million higher compared to the same period in 2025, primarily due to higher sales and a favorable product mix.
Outlook
AGCO's net sales for 2026 are expected to be from $9.8 to $10.0 billion. Adjusted operating margins are projected to be about 7.0% reflecting continued emphasis on pricing discipline, cost management and operational alignment. Production volumes are planned to align dealer inventory with market demand, while cost controls and positive pricing continue to support performance. Based on these assumptions, 2026 adjusted earnings per share is targeted at approximately $5.50. These estimates reflect tariff policies as of October 29, 2026, together with AGCO's established mitigation actions and sourcing strategies. Any changes to tariff policies or related responses could affect these projections.
AGCO will host a conference call for this earnings announcement at 10 a.m. Eastern Time on Thursday, October 29. The Company will refer to slides on its conference call. Interested persons can access the conference call and slide presentation via AGCO's website at www.agcocorp.com under the "Investors" section. The webcast will also be archived immediately afterward for 12 months. A copy of this press release will be available on AGCO's website for at least 12 months following the call.
Safe Harbor Statement
Statements that are not historical facts, including the projections of earnings per share, production levels, sales, industry demand, market conditions, commodity prices, currency translation, farm income levels, margin levels, strategy, investments in product and technology development, new product introductions, restructuring and other cost reduction initiatives, production volumes, tax rates and general economic conditions, are forward-looking and subject to risks that could cause actual results to differ materially from those suggested by the statements. The following are among the factors that could cause actual results to differ materially from the results discussed in or implied by the forward-looking statements.
- Our financial results depend entirely upon the agricultural industry, and factors that adversely affect the agricultural industry generally, including declines in the general economy, adverse weather, tariffs, increases in farm input costs, lower commodity prices, lower farm income and changes in the availability of credit for our retail customers, will adversely affect us.
- We maintain an independent dealer and distribution network in the markets where we sell products. The financial and operational capabilities of our dealers and distributors are critical to our ability to compete in these markets. Higher inventory levels at our dealers and high utilization of dealer credit limits as well as the financial health of our dealers could negatively impact future sales and adversely impact our performance.
- On April 1, 2024, we completed the acquisition of the ag assets and technologies of Trimble through the formation of a joint venture, PTx Trimble, of which we own 85%. Financing the PTx Trimble transaction significantly increased our indebtedness and interest expense. We also have made various assumptions relating to the acquisition that may not prove to be correct, and we may fail to realize all of the anticipated benefits of the acquisition. All acquisitions involve risk, and there is no certainty that the acquired business will operate as expected. Each of these items, as well as similar acquisition-related items, would adversely impact our performance.
- A majority of our sales and manufacturing takes place outside the United States, and many of our sales involve products that are manufactured in one country and sold in a different country. As a result, we are exposed to risks related to foreign laws, taxes and tariffs, trade restrictions, economic conditions, labor supply and relations, political conditions and governmental policies. In 2025, the U.S. government implemented a series of tariffs on goods imported into the United States from various countries, and in many cases these measures resulted in reciprocal tariffs and other actions on goods exported from the United States. These tariffs and related actions are complex, continuously evolving and remain highly volatile as trade negotiations and legal challenges proceed. In February 2026, the U.S. Supreme Court ruled that the International Emergency Economic Powers Act ("IEEPA"), which the U.S. government had relied on to impose certain tariffs, does not authorize the administration to impose such tariffs. Following that decision, on March 4, 2026, the U.S. Court of International Trade ("CIT") ordered U.S. Customs and Border Protection ("CBP") to process refunds of tariffs imposed under IEEPA, and on March 27, 2026, the CIT issued an amended order expanding the scope of entries subject to reliquidation. On April 20, 2026, the Consolidated Administration and Processing of Entries ("CAPE") system opened for the first phase of refund filings, and on June 29, 2026, CBP expanded CAPE to accept additional categories of entries. We have submitted refund claims under both phases and, as of the date of this release, have received refunds with respect to a portion of those claims. Certain other entries remain subject to refund procedures that CBP has not yet defined. Refunds received remain subject to CBP review and to the outcome of the administration's appeal described below, and we could be required to repay some or all of the amounts received. The administration has appealed the CIT's refund order to the U.S. Court of Appeals for the Federal Circuit, contesting both the scope of the refund obligation and the reliquidation of finally liquidated entries for importers who have not filed individual lawsuits. Accordingly, we cannot predict the timing or amount of any additional refunds, or whether refunds already received will ultimately be retained. Following the U.S. Supreme Court's ruling, the administration has also imposed tariffs under alternative statutory authorities, the validity of which is also subject to legal challenge. As a result, the timing and extent of any refunds, the structure and scope of any new tariffs and the overall tariff framework remain uncertain and could create significant risks for our business. Depending on the countries affected, increases in tariffs have raised, and may continue to raise, the costs of inputs used in manufacturing our products, which in turn has impacted, and may further impact, our cost of goods sold. In addition, higher tariffs may lead to increased after‑tariff sales prices for the products we sell. Additionally, the economic uncertainty caused by the tariffs may result in customers delaying planned purchases of products and services. While impacts of the tariffs may be partially mitigated by the fact that a majority of our sales and manufacturing takes place outside the United States, there can be no guarantee that we will be able to fully offset the impact of existing or future tariffs through pricing, sourcing changes or other measures. Furthermore, retaliatory tariffs imposed by other countries on our exported products could negatively affect our sales and marketplace access in those countries. The economic uncertainty caused by these tariffs and related trade policy developments, together with uncertainty regarding their enforceability, continuation or modification, has adversely impacted, and is expected to continue to adversely impact, our sales.
- We cannot predict or control the impact of the conflicts in Ukraine or the Middle East on our business. These conflicts have already driven increased volatility across global energy, logistics and input markets, leading to higher fuel, fertilizer, transportation and input costs, as well as general uncertainty for farmers. There is a potential for natural gas shortages, as well as shortages in other energy sources including diesel fuel, throughout Europe, which could negatively impact our production in Europe both directly and through interrupting the supply of parts and components that we use. It is unclear how long these conditions will continue, or whether they will worsen, and what the ultimate impact on our performance will be. In addition, AGCO sells products in, and purchases parts and components from, other regions where there could be hostilities. Any hostilities likely would adversely impact our performance.
- Most retail sales of the products that we manufacture are financed, either by our joint ventures with Rabobank or by a bank or other private lender. The AGCO Finance joint ventures with Rabobank, which are wholly owned or controlled by Rabobank and are dependent upon Rabobank for financing as well, finance approximately 50% of the retail sales of our tractors and combines in the markets where the joint ventures operate. Any difficulty by Rabobank to continue to provide that financing, or any business decision by Rabobank as the controlling member not to fund the business or particular aspects of it (for example, a particular country or region), would require the joint ventures to find other sources of financing (which may be difficult to obtain), or us to find another source of retail financing for our customers, or our customers would be required to utilize other retail financing providers. As a result of the recent economic downturn, financing for capital equipment purchases generally has become more difficult in certain regions and in some cases, can be expensive to obtain. To the extent that financing is not available or available only at unattractive prices, our sales would be negatively impacted. In addition, Rabobank also is the lead lender in our revolving credit facility and term loans and for many years has been an important financing partner for us. Any interruption or other challenges in that relationship would require us to obtain alternative financing, which could be difficult.
- Both AGCO and our finance joint ventures have substantial accounts receivable from dealers and end customers, and we would be adversely impacted if the collectability of these receivables was less than optimal; this collectability is dependent upon the financial strength of the farm industry, which in turn is dependent upon the general economy and commodity prices, as well as several of the other factors listed in this section.
- We can experience substantial and sustained volatility with respect to currency exchange rate and interest rate changes, which can adversely affect our reported results of operations and the competitiveness of our products.
- Our success depends on the introduction of new products, particularly engines that comply with emission requirements and sustainable smart farming technology, which require substantial expenditures; there is no certainty that we can develop the necessary technology or that the technology that we develop will be attractive to farmers or available at competitive prices.
- Our expansion plans in emerging markets, including establishing a greater manufacturing and marketing presence and growing our use of component suppliers, could entail significant risks.
- Our business is increasingly subject to regulations relating to privacy and data protection, and if we violate any of those regulations, or otherwise are the victim of a cyberattack, we could be subject to significant claims, penalties and damages.
- Cybersecurity breaches including ransomware attacks and other means are rapidly increasing. We continue to review and improve our safeguards to minimize our exposure to future attacks. However, there remains a risk that a successful cyberattack could disrupt our business, including by interrupting operations, destroying or exfiltrating data, or otherwise compromising our systems.
- We depend on suppliers for components, parts and raw materials for our products, and any failure by our suppliers to provide products as needed, or by us to promptly address supplier issues, will adversely impact our ability to timely and efficiently manufacture and sell products. In addition, the potential of future natural gas shortages in Europe, as well as predicted overall shortages in other energy sources, could also negatively impact our production and that of our supply chain in the future. There can be no assurance that there will not be future disruptions.
- Any future pandemics could negatively impact our business through reduced sales, facility closures, higher absentee rates and reduced production at both our plants and the plants that supply us with parts and components. In addition, logistical and transportation-related issues and similar problems may also arise.
- We have previously experienced significant inflation in a range of costs, including for parts and components, shipping and energy. While we have been able to pass along most of those costs through increased prices, there can be no assurance that we will be able to continue to do so. If we are not, it will adversely impact our performance.
- We face significant competition, and if we are unable to compete successfully against other agricultural equipment manufacturers, we would lose customers and our net sales and performance would decline.
- We have a substantial amount of indebtedness (and have incurred additional indebtedness as part of the PTx Trimble joint venture transaction), and, as a result, we are subject to certain restrictive covenants and payment obligations, as well as increased leverage generally, that may adversely affect our ability to operate and expand our business.
Further information concerning these and other factors is included in AGCO's filings with the Securities and Exchange Commission, including its Form 10-K for the year ended December 31, 2025, and subsequent Form 10-Qs. AGCO disclaims any obligation to update any forward-looking statements except as required by law.
About AGCO
AGCO (NYSE: AGCO) is a global leader in agricultural machinery and precision agriculture technologies. Driven by a Farmer-First strategy, AGCO delivers value through its differentiated leading brands, Fendt™, Massey Ferguson™, PTx™ and Valtra™. AGCO's high-performance equipment and smart farming solutions, including brand-agnostic retrofit technologies and autonomous offerings, empower farmers to drive productivity while sustainably feeding the world. For more information, visit www.agcocorp.com.
CONDENSED CONSOLIDATED BALANCE SHEETS
(unaudited and in millions)
CONDENSED CONSOLIDATED STATEMENTS OF OPERATIONS
(unaudited and in millions, except per share data)
CONDENSED CONSOLIDATED STATEMENTS OF OPERATIONS
(unaudited and in millions, except per share data)
CONDENSED CONSOLIDATED STATEMENTS OF CASH FLOWS
(unaudited and in millions)
AGCO CORPORATION
NOTES TO CONDENSED CONSOLIDATED FINANCIAL STATEMENTS
(unaudited, in millions)
1. SEGMENT REPORTING
The Company has four operating segments which are also its reportable segments which consist of the North America, Latin America, Europe/Middle East and Asia/Pacific/Africa regions. Effective January 1, 2026, the Company realigned its organizational structure to support its Farmer‑First transformation initiatives in North America. As a result, the Company's Mexico operations were transferred from the North America segment to the South America segment, which was renamed Latin America. Segment information for all prior periods presented has been retrospectively adjusted to reflect this change. The Company's reportable segments are geography based and distribute a full range of agricultural machinery and precision agriculture technology. The Company's Chief Operating Decision Maker ("CODM"), Eric P. Hansotia, Chairman of the Board, President and Chief Executive Officer, evaluates segment performance primarily based on income from operations. The CODM utilizes income from operations to evaluate each segment's performance including the allocation of resources. Sales for each segment are based on the location of the third-party customer. The Company's selling, general and administrative expenses and engineering expenses are generally charged to each segment based on the region and division where the expenses are incurred. As a result, the components of income (loss) from operations for one segment may not be comparable to another segment. Segment results for the three and nine months ended September 30, 2026 and 2025 based on the Company's reportable segments are as follows (in millions):
America
A reconciliation from the segment information to the consolidated balances for income from operations is set forth below (in millions):
September 30,
September 30,
RECONCILIATION OF NON-GAAP MEASURES
This earnings release discloses adjusted income from operations, adjusted operating margin, adjusted net income, adjusted net income per share and net sales on a constant currency basis, each of which excludes amounts that are typically included in the most directly comparable measure calculated in accordance with U.S. generally accepted accounting principles ("GAAP"). A reconciliation of each of those measures to the most directly comparable GAAP measure is included below.
The following is a reconciliation of reported income from operations, net income attributable to AGCO and net income per share attributable to AGCO to adjusted income from operations, adjusted net income and adjusted net income per share for the three and nine months ended September 30, 2026 and 2025 (in millions, except per share data):
The following is a reconciliation of adjusted operating margin for the three and nine months ended September 30, 2026 and 2025 (in millions, except margin data):
The Company does not provide a quantitative reconciliation of forward-looking, non-GAAP financial measures to the most directly comparable GAAP financial measure because it is difficult to reliably predict or estimate the relevant components without unreasonable effort due to future uncertainties that may potentially have a significant impact on such calculations and providing them may imply a degree of precision that would be confusing or potentially misleading.
The following tables set forth, for the three and nine months ended September 30, 2026 and 2025, the impact to net sales of currency translation by geographical segment (in millions, except percentages):
 View original content to download multimedia:https://www.prnewswire.com/news-releases/agco-reports-third-quarter-results-302922683.html
SOURCE AGCO Corporation









 Audio
 Teilen