Asset Klassen
Kurslisten
Hinweis zu Meine Suchen: Meine Suchen sind aufgrund der vielfachen Bitte aus der Community wieder unter Mein Portfolio zu finden.
Meistgeklickt









Hot News
Heiße Themen (24h)
| Evotec SE | 2,898 € | +1,47% | ||
| Qiagen NV | 50,79 $ | +0,81% | ||
| BB Biote. | 51,80 ¤ | +0,39% | ||
| - | - | |||
| Sartorius. | 290,00 € | -0,65% | ||
| Sartorius. | 227,00 € | -0,66% | ||
| Formyco. | 18,76 € | -1,16% | ||
| Heidelbe. | 2,02 € | -2,42% |
| Heidelbe. | 2,02 € | -2,42% | ||
| Formyco. | 18,76 € | -1,16% | ||
| Sartorius. | 227,00 € | -0,66% | ||
| Sartorius. | 290,00 € | -0,65% | ||
| - | - | |||
| BB Biote. | 51,80 ¤ | +0,39% | ||
| Qiagen NV | 50,79 $ | +0,81% | ||
| Evotec SE | 2,898 € | +1,47% |

| Handelsplatz | Letzter | Änderung | Vortag | Zeit | |
|---|---|---|---|---|---|
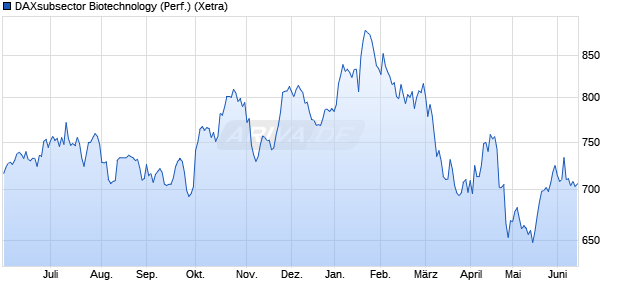
| Xetra | 899,33 | -0,22% | 901,28 | 04.11.26 | |
| Aktie | Marktkap. in Mio. € | Anzahl Jahre Outperformance | Performance Ø |
|---|---|---|---|
| Evotec SE | 1.029,34 | 6 | +17,33% |
| Sartorius AG Vz | 10.094,90 | 6 | +22,72% |
| Heidelberg Pharma AG | 94,50 | 5 | +17,38% |
| Datum | Kurs |
|---|---|
| 03.11.26 | 901,28 |
| 02.11.26 | 903,99 |
| 30.10.26 | 900,55 |
| 29.10.26 | 907,82 |
| 28.10.26 | 898,67 |
| Name | Letzter | Performance | |
|---|---|---|---|
| DAX | 26.574 | +2,82% | |
| Indikation auf US Tec. | 28.619 | +1,53% | |
| MDAX (Perf.) | 31.140 | +1,73% | |
| SDAX (Perf.) | 18.290 | +1,77% | |
| Nasdaq-100 Index E. | 5.005 | +1,16% | |
| MSCI World | 4.933 | +1,88% | |
| AT 20 (Austrian Trad. | 6.518 | +1,50% | |
| Indikation auf US 500 | 7.672 | +1,37% | |
| Euro Stoxx 50 | 6.269 | +2,02% | |
| TecDAX (Perf.) | 4.146 | +1,75% |
| Wertpapier | Beiträge | Perf. |
| Evotec SE | 1 | - |
| Pentixapharm Holding AG | 1 | - |