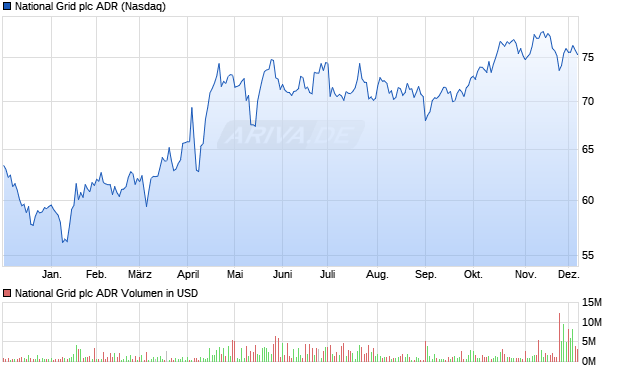
| Geld/Brief | 63,70 $ / 88,17 $ |
| Spread | +38,41% |
| Schluss Vortag | 77,58 $ |
| Gehandelte Stücke | 129.316 |
| Tagesvolumen Vortag | 7.360.000 $ |
| Tagestief 76,345 $ Tageshoch 76,96 $ | |
| 52W-Tief 70,03 $ 52W-Hoch 94,62 $ | |
| Jahrestief 74,56 $ Jahreshoch 94,62 $ | |
| Umsatz in Mio. | 17.975 $ |
| Operatives Ergebnis (EBIT) in Mio. | 5.870 $ |
| Jahresüberschuss in Mio. | 3.294 $ |
| Umsatz je Aktie | 18,08 $ |
| Gewinn je Aktie | 3,31 $ |
| Gewinnrendite | +18,32% |
| Umsatzrendite | +18,32% |
| Return on Investment | +3,04% |
| Marktkapitalisierung in Mio. | 75.362 $ |
| KGV (Kurs/Gewinn) | 19,30 |
| KBV (Kurs/Buchwert) | 1,62 |
| KUV (Kurs/Umsatz) | 3,54 |
| Eigenkapitalrendite | +8,38% |
| Eigenkapitalquote | +36,29% |
| Dividendenrendite 5,12% |
| Auszahlungen/Jahr 2 |
| Stabilität der Dividende 0,30 (max 1,00) |
| Jährlicher -0,13% (5 Jahre) Dividendenzuwachs -1,48% (10 Jahre) |
| Ausschüttungs- 39,47% (auf den Gewinn/FFO) quote |
| Erwartete Dividendensteigerung 0,07% |
| Datum | Dividende |
| 22.11.2024 | 1,02 $ |
| 07.06.2024 | 2,49 $ |
| 22.11.2023 | 1,19 $ |
| 23.11.2022 | 1,02 $ |
| 03.06.2022 | 2,07 $ |
| 02.12.2021 | 1,15 $ |
| 03.06.2021 | 2,26 $ |
| 25.11.2020 | 1,12 $ |

| Handelsplatz | Letzter | Änderung | Vortag | Zeit | |
|---|---|---|---|---|---|
| AMEX | 76,73 $ | -0,79% | 77,34 $ | 18.09.26 | |
| Düsseldorf | 65,50 € | -1,50% | 66,50 € | 18.09.26 | |
| Frankfurt | 66,00 € | +2,33% | 64,50 € | 18.09.26 | |
| Gettex | 67,00 € | 0 % | 67,00 € | 18.09.26 | |
| Hamburg | 66,00 € | -0,75% | 66,50 € | 18.09.26 | |
| Hannover | 66,00 € | -0,75% | 66,50 € | 18.09.26 | |
| L&S RT | 67,00 € | -0,74% | 67,50 € | 18.09.26 | |
| München | 66,50 € | 0 % | 66,50 € | 18.09.26 | |
| Nasdaq | 76,81 $ | -0,99% | 77,58 $ | 18.09.26 | |
| NYSE | 76,80 $ | 0 % | 76,80 $ | 01:00 | |
| Quotrix | 64,50 € | 0 % | 64,50 € | 15.09.26 | |
| Datum | Kurs | Volumen |
|---|---|---|
| 17.09.26 | 77,58 | 8,13 M |
| 16.09.26 | 76,00 | 9,45 M |
| 15.09.26 | 74,91 | 10,7 M |
| 14.09.26 | 74,975 | 10,0 M |
| 11.09.26 | 76,86 | 8,47 M |
| Zeitraum | Kurs | % |
|---|---|---|
| 1 Woche | 76,86 $ | +0,94% |
| 1 Monat | 82,165 $ | -5,58% |
| 6 Monate | 87,39 $ | -11,23% |
| 1 Jahr | 70,02 $ | +10,80% |
| 5 Jahre | 66,05 $ | +17,46% |

| Marktkapitalisierung | 75,36 Mrd. $ |
| Streubesitz | 94,03% |
| Währung | USD |
| Land | USA |
| Sektor | Versorger |
| Branche | Stromversorgung (Reguliert) |
| Aktientyp | ADR |
| +0,60% | FMR Inc |
| +0,46% | Bank of America Corp |
| +0,32% | Federated Hermes Inc |
| +0,32% | Renaissance Technologies Corp |
| +0,25% | 40 North Industries LLC |
| +0,24% | Milford Funds Limited |
| +0,22% | JONES FINANCIAL COMPANIES LLLP |
| +0,22% | Royal Bank of Canada |
| +0,21% | The Goldman Sachs Group Inc |
| +0,21% | Morgan Stanley - Brokerage Accounts |
| +0,21% | JPMorgan Chase & Co |
| +0,21% | Goldman Sachs Group Inc |
| +0,2% | Natixis Advisors, LLC. |
| +0,19% | Connor Clark & Lunn Inv Mgmt Ltd |
| +0,18% | QRG Capital Management, Inc. |
| +0,18% | Envestnet Asset Management Inc |
| +0,16% | Wells Fargo & Co |
| +0,1% | BlackRock Inc |
| +0,1% | Northern Trust Corp |
| +0,1% | Bank of Montreal |
| +0,1% | BMO Capital Markets Corp. |
| +0,1% | Capital Research & Mgmt Co - Division 3 |
| +0,1% | LPL Financial Corp |
| +0,09% | SG Americas Securities, LLC |
| +0,09% | Federated Hermes Strategic Val Dividend |
| +0,09% | Clark Navigator International Equity/ADR |
| +0,09% | Clark Capital Management Group Inc |
| +0,08% | Brandes Investment Partners & Co |
| +0,08% | Cullen Capital Management, LLC |
| +0,07% | Causeway Capital Management LLC |
| +0,07% | Dimensional Fund Advisors, Inc. |
| +0,04% | BMO Global Infrastructure ETF |
| +0,04% | Schafer Cullen Int'l High Dividend ADR |
| +0,03% | Invesco International Div Achiev ETF |
| +0,03% | DFA International Core Equity 2 I |
| +0,02% | iShares Global Infrastructure ETF Comm |
| +0,02% | Brandes US Value A Euro |
| +0,02% | Avantis International Equity ETF |
| +0,02% | JH Tax-Advantaged Dividend Inc |
| +0,02% | iShares Dynamic Equity Active ETF |
| +0,02% | JH Premium Dividend Fund |
| +0,02% | Hennessy Gas Utility Investor |
| +0,02% | Nuveen Real Asset Income |
| +0,02% | Goldman Sachs Income Builder A |
| +0,01% | Brandes International ETF |
| +0,01% | Fidelity Enhanced International ETF |
| +0,01% | Causeway Simulated Global Val ADR Model |
| +0,01% | Cantor Fitzgerald Infrastructure A |
| +0,01% | Global X U.S. Electrification ETF |
| +0,01% | Dimensional International Core Eq 2 ETF |
| +0,01% | NBI Global Real Assets Income ETF |
| +0,01% | DFA Large Cap International I |
| +0,01% | Steward Values Enhanced International I |
| +0,01% | Nuveen Real Asset Income and Growth |
| +0,01% | Nuveen Real Asset Income I |
| +0,01% | Gabelli Utility Trust |
| +5,893% | Institutionelle Aktionäre |
| +0,076% | Insider Aktionäre |
| +94,031% | Streubesitz |