Asset Klassen
Kurslisten
Hinweis zu Meine Suchen: Meine Suchen sind aufgrund der vielfachen Bitte aus der Community wieder unter Mein Portfolio zu finden.
Meistgeklickt









Hot News
Heiße Themen (24h)

| Geld/Brief | 42,78 $ / 42,98 $ |
| Spread | +0,47% |
| Schluss Vortag | 43,03 $ |
| Gehandelte Stücke | 24.302 |
| Tagesvolumen Vortag | 58.470.162 $ |
| Tagestief 42,09 $ Tageshoch 43,00 $ | |
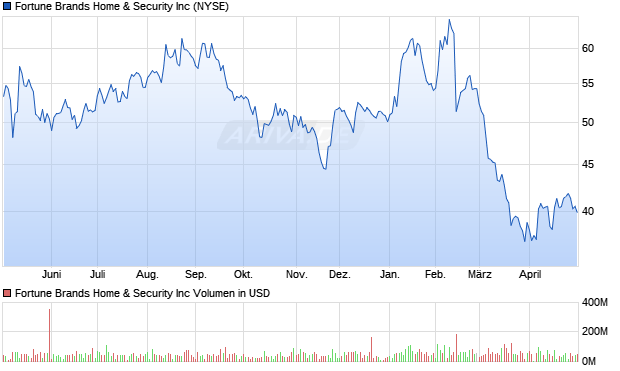
| 52W-Tief 32,34 $ 52W-Hoch 64,71 $ | |
| Jahrestief 32,34 $ Jahreshoch 64,71 $ | |


| Umsatz in Mio. | 4.463 $ |
| Operatives Ergebnis (EBIT) in Mio. | 520,20 $ |
| Jahresüberschuss in Mio. | 298,80 $ |
| Umsatz je Aktie | 37,07 $ |
| Gewinn je Aktie | 2,48 $ |
| Gewinnrendite | +6,69% |
| Umsatzrendite | +6,69% |
| Return on Investment | +4,58% |
| Marktkapitalisierung in Mio. | 5.224 $ |
| KGV (Kurs/Gewinn) | 20,17 |
| KBV (Kurs/Buchwert) | 2,52 |
| KUV (Kurs/Umsatz) | 1,35 |
| Eigenkapitalrendite | +12,51% |
| Eigenkapitalquote | +36,63% |
| Faktor-Zertifikate | 38 | |
| Knock-Outs | 10 |
| Dividendenrendite 2,32% |
| Auszahlungen/Jahr 4 |
| Gesteigert seit 2 Jahren |
| Keine Senkung seit 2 Jahren |
| Stabilität der Dividende 0,94 (max 1,00) |
| Jährlicher 4,04% (5 Jahre) Dividendenzuwachs 7,65% (10 Jahre) |
| Ausschüttungs- 40,73% (auf den Gewinn/FFO) quote % (auf den Free Cash Flow) |
| Erwartete Dividendensteigerung -18,45% |
| Datum | Dividende |
| 21.08.2026 | 0,26 $ |
| 22.05.2026 | 0,26 $ |
| 20.02.2026 | 0,26 $ |
| 21.11.2025 | 0,25 $ |
| 22.08.2025 | 0,25 $ |
| 27.05.2025 | 0,25 $ |
| 21.02.2025 | 0,25 $ |
| 22.11.2024 | 0,24 $ |

| Handelsplatz | Letzter | Änderung | Vortag | Zeit | |
|---|---|---|---|---|---|
| Düsseldorf | 38,40 € | +1,05% | 38,00 € | 12:30 | |
| Frankfurt | 38,40 € | +0,52% | 38,20 € | 08:00 | |
| Gettex | 38,41 € | -0,05% | 38,43 € | 16:13 | |
| Hannover | 38,40 € | -1,03% | 38,80 € | 09:10 | |
| L&S RT | 38,40 € | -0,26% | 38,50 € | 16:35 | |
| Nasdaq | 42,815 $ | -0,52% | 43,04 $ | 16:20 | |
| NYSE | 42,79 $ | -0,56% | 43,03 $ | 16:20 | |
| NYSE American | 42,74 $ | -0,63% | 43,01 $ | 15:12 | |
| Quotrix | 38,40 € | -1,54% | 39,00 € | 26.10.26 | |
| Stuttgart | 38,40 € | 0 % | 38,40 € | 16:18 | |
| Tradegate BSX | 39,40 € | +2,07% | 38,60 € | 23.10.26 | |
| Datum | Kurs | Volumen |
|---|---|---|
| 26.10.26 | 43,03 | 48,5 M |
| 23.10.26 | 42,98 | 48,1 M |
| 22.10.26 | 43,79 | 25,9 M |
| 21.10.26 | 40,95 | 40,6 M |
| 20.10.26 | 40,79 | 15,1 M |
| 19.10.26 | 40,18 | 16,6 M |
| Zeitraum | Kurs | % |
|---|---|---|
| 1 Woche | 40,18 $ | +7,09% |
| 1 Monat | 39,38 $ | +9,27% |
| 6 Monate | 41,54 $ | +3,59% |
| 1 Jahr | 50,80 $ | -15,30% |
| 5 Jahre | 83,3419 $ | -48,37% |

| Marktkapitalisierung | 5,22 Mrd. $ |
| Streubesitz | -9,31% |
| Währung | USD |
| Land | USA |
| Sektor | Industrie |
| Branche | Bauausrüstung und Produkte |
| Aktientyp | Stammaktie |
| +16,21% | BlackRock Inc |
| +6,39% | Harris Associates L.P. |
| +5,74% | Pictet Asset Manangement SA |
| +4,75% | Oakmark Investor |
| +4,49% | Vanguard Portfolio Management, LLC |
| +4,35% | Vanguard Capital Management, LLC |
| +3,85% | Dimensional Fund Advisors, Inc. |
| +3,79% | Pictet-Water I EUR |
| +3,56% | iShares Core S&P Mid-Cap ETF |
| +3,30% | Garden Investment Management, L.P. |
| +3,21% | State Street Corp |
| +3,20% | First Pacific Advisors, LP |
| +3,02% | Vanguard MStar Total Stk Mkt Idx Invest |
| +2,21% | BlackRock Equity Dividend Instl |
| +2,14% | Vanguard Small Cap Index |
| +2,08% | Freestone Grove Partners LP |
| +1,97% | FPA Crescent |
| +1,84% | Geode Capital Management, LLC |
| +1,67% | Amundi |
| +1,62% | Fiduciary Management, Inc. of Milwaukee |
| +1,58% | Adage Capital Partners Gp LLC |
| +1,53% | Atlas FRM LLC |
| +1,46% | Canada Pension Plan Investment Board |
| +1,42% | NORGES BANK |
| +1,41% | Southeastern Asset Management Inc |
| +1,39% | Vanguard MStar Small Cap Value Index |
| +1,39% | Point72 Asset Management, L.P. |
| +1,35% | Millennium Management LLC |
| +1,17% | Franklin Small Cap Value A |
| +0,84% | FMI Common Stock Investor |
| +0,80% | Longleaf Partners |
| +0,74% | State Street® SPDR® S&P MIDCAP 400® ETF |
| +0,73% | Neuberger Genesis Inv |
| +0,73% | DFA US Targeted Value I |
| +0,72% | Pictet-Global Megatrend Sel I USD |
| +0,70% | Pictet-Security I USD |
| +0,68% | First Trust Water ETF |
| +0,67% | BlackRock Large Cap Focus Value Instl |
| +0,67% | Fidelity Greater Canada Sr F |
| +0,64% | Dimensional US Targeted Value ETF |
| +108,776% | Institutionelle Aktionäre |
| +0,53% | Insider Aktionäre |
| -9,306% | Streubesitz |
| 15.12.2022 | Split | 100:117 |