


- Community-Beiträge
- Aktuellste Threads


Asset Klassen
Kurslisten
Hinweis zu Meine Suchen: Meine Suchen sind aufgrund der vielfachen Bitte aus der Community wieder unter Mein Portfolio zu finden.
Meistgeklickt
Hot News
Heiße Themen (24h)

| Geld/Brief | 0,545 $ / 0,562 $ |
| Spread | +3,12% |
| Schluss Vortag | 0,5536 $ |
| Gehandelte Stücke | 33.767 |
| Tagesvolumen Vortag | 16.990,42 $ |
| Tagestief 0,5536 $ Tageshoch 0,5536 $ | |
| 52W-Tief 0,3595 $ 52W-Hoch 6,02 $ | |
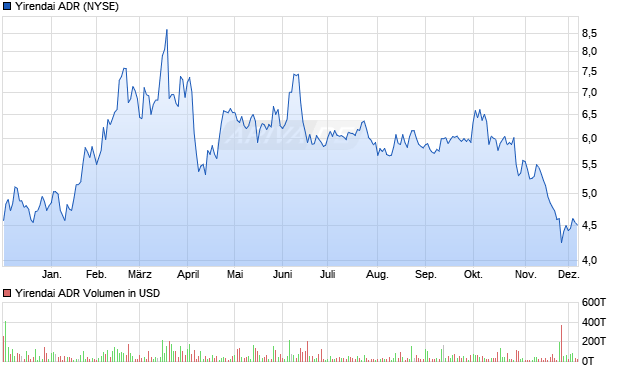
| Jahrestief 0,3595 $ Jahreshoch 4,44 $ | |
| Umsatz in Mio. | 5.572 $ |
| Operatives Ergebnis (EBIT) in Mio. | -56,91 $ |
| Jahresüberschuss in Mio. | 39,42 $ |
| Umsatz je Aktie | 127,89 $ |
| Gewinn je Aktie | 0,90 $ |
| Gewinnrendite | +0,71% |
| Umsatzrendite | +0,71% |
| Return on Investment | +0,29% |
| Marktkapitalisierung in Mio. | 64,64 $ |
| KGV (Kurs/Gewinn) | 28,78 |
| KBV (Kurs/Buchwert) | 0,12 |
| KUV (Kurs/Umsatz) | 0,20 |
| Eigenkapitalrendite | +0,43% |
| Eigenkapitalquote | +68,91% |
| Faktor-Zertifikate | 3 |
| Dividendenrendite 7,34% |
| Auszahlungen/Jahr 2 |
| Gesteigert seit 1 Jahr |
| Keine Senkung seit 1 Jahr |
| Ausschüttungs- 342,29% (auf den Gewinn/FFO) quote % (auf den Free Cash Flow) |
| Datum | Dividende |
| 30.09.2025 | 0,22 $ |
| 30.04.2025 | 0,22 $ |
| 30.09.2024 | 0,20 $ |
| 27.04.2018 | 0,23 $ |
| 28.09.2017 | 1,27 $ |

| Handelsplatz | Letzter | Änderung | Vortag | Zeit | |
|---|---|---|---|---|---|
| Düsseldorf | 0,476 € | -15,00% | 0,56 € | 27.10.26 | |
| Frankfurt | 0,50 € | -10,71% | 0,56 € | 27.10.26 | |
| Gettex | 0,51 € | -3,77% | 0,53 € | 27.10.26 | |
| L&S RT | 0,489 € | -7,12% | 0,5265 € | 27.10.26 | |
| München | 0,525 € | -13,93% | 0,61 € | 27.10.26 | |
| Nasdaq | 0,5513 $ | -3,30% | 0,5701 $ | 27.10.26 | |
| NYSE | 0,5536 $ | 0 % | 0,5536 $ | 28.10.26 | |
| NYSE American | 0,7228 $ | 0 % | 0,7228 $ | 21.10.26 | |
| Quotrix | 0,705 € | 0 % | 0,705 € | 16.10.26 | |
| Stuttgart | 0,48 € | -4,95% | 0,505 € | 27.10.26 | |
| Tradegate BSX | 0,595 € | +19,00% | 0,50 € | 23.10.26 | |
| Datum | Kurs | Volumen |
|---|---|---|
| 26.10.26 | 0,5746 | 44.356 |
| 23.10.26 | 0,6725 | 52 T |
| 22.10.26 | 0,7145 | 9.213 |
| 21.10.26 | 0,7746 | 22.935 |
| 20.10.26 | 0,7388 | 44.564 |
| Zeitraum | Kurs | % |
|---|---|---|
| 1 Woche | 0,7388 $ | -22,23% |
| 1 Monat | 0,9907 $ | -42,00% |
| 6 Monate | 2,14 $ | -73,15% |
| 1 Jahr | 6,02 $ | -90,46% |
| 5 Jahre | 3,32 $ | -82,69% |

| Marktkapitalisierung | 64,64 Mio. $ |
| Streubesitz | 97,51% |
| Währung | USD |
| Land | USA |
| Sektor | Finanzdienstleistung |
| Branche | Kreditdienstleistung |
| Aktientyp | ADR |
| +1,18% | Dimensional Fund Advisors, Inc. |
| +0,38% | DFA Emerging Markets Core Equity 2 I |
| +0,31% | Renaissance Technologies Corp |
| +0,25% | Morgan Stanley - Brokerage Accounts |
| +0,22% | DFA Emerging Markets Value I |
| +0,16% | DFA Emerging Markets Small Cap I |
| +0,15% | Ramsey Quantitative Systems Inc |
| +0,12% | GSA Capital Partners LLP |
| +0,07% | Verdad Advisers, LP |
| +0,06% | Rainbow Emerging Markets Equities |
| +0,06% | Acadian Asset Management LLC |
| +0,05% | Dimensional EM Core Equity Acc |
| +0,05% | Dimensional Emerging Mkts Val EUR Acc |
| +0,03% | DFA International Core Equity Class F |
| +0,03% | Trexquant Investment LP |
| +0,03% | HRT FINANCIAL LLC |
| +0,03% | SmartHarvest Portfolios, LLC |
| +0,03% | American Century Companies Inc |
| +0,02% | DFA Emerging Markets Social Core Port |
| +0,02% | Dimensional World Equity GBP Acc |
| +0,02% | DFA Emerging Markets Trgt Val Instl |
| +0,02% | DFA International Vector Equity Class F |
| +0,02% | SEI Investments Co |
| +0,02% | IMC-Chicago, LLC |
| +0,01% | Dimensional World Allc 60/40 GBP Acc |
| +0,01% | DFA Em Mkts Sustnby Cor 1 Instl |
| +0,01% | Dimensional EM Cor Eq LC ESG Sc USD A |
| +0,01% | XTX Topco Ltd |
| +0,01% | Virtu Financial LLC |
| +0,01% | BNP Paribas Arbitrage, SA |
| +0,01% | Citigroup Inc |
| - % | Rainbow Balanced Portfolio 3 |
| - % | Avantis® Emerging Markets Equity Instl |
| - % | DFA World ex US Core Equity Instl |
| - % | Royal Bank of Canada |
| - % | Group One Trading, LLC |
| - % | JPMorgan Chase & Co |
| +2,495% | Institutionelle Aktionäre |
| +97,505% | Streubesitz |