Viant Technology Inc

Aktie
WKN:  A2QN43 ISIN:  US92557A1016 US-Symbol:  DSP Branche:  Software Land:  USA
12,74 $
-0,08 $
-0,62%
10,973 € 10.09.26
Depot/Watchlist
Marktkapitalisierung *
910,40 Mio. $
Streubesitz
33,81%
KGV
22,37
Index-Zuordnung
-
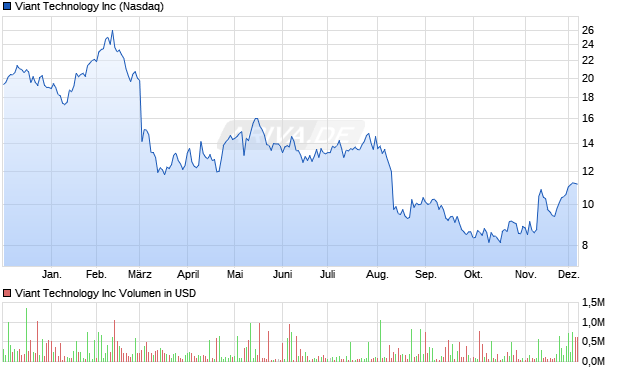
Viant Technology Aktie Chart

Viant Technology Unternehmensbeschreibung

Viant Technology Inc. operates a cloud-based demand side platform (DSP) that enables the programmatic purchase of digital advertising across multiple channels, including connected TV (CTV), streaming audio, digital out-of-home, mobile, and desktop. It provides ViantAI, an artificial intelligence product suite; Holistic, Omnichannel DSP, an integrated platform that manages omnichannel campaigns and access metrics; Household ID, which combines digital and personal identifiers into a normalized household profile; IRIS_ID, a content identifier that allows partners to share video-level data to power planning, targeting, and measurement solutions in ad-supported streaming media; and Viant Data Platform, which offers the ability to integrate first-party data with data from top third-party data providers to obtain key insights, reporting, and attribution opportunities. The company also offers Direct Access, a supply path optimization program that creates a direct path to premium inventory; Advanced Reporting and Measurement that offers conversion lift, multitouch attribution, foot-traffic data reports, digital-out-of-home lift, sales reporting, and ROAS analytics; and Flexible Customer Engagement Model, which offers customers transparency and control over their advertising campaigns and underlying data infrastructure. The company sells its platform through a direct sales team focused on business development in various markets. It serves purchasers of programmatic advertising inventory and large, independent, and mid-market advertising agencies, as well as marketers. The company was formerly known as Interactive Media Holdings and changed its name to Viant Technology Inc. im Januar 2015. The company was founded in 1999 and is headquartered in Irvine, California.
Werbung

Börsenspiel Trader: Mit Training zum Erfolg

Werden Sie mit Ihrer Handelsstrategie der Trader 2026 und gewinnen Sie einen Range Rover Evoque. Hier anmelden!

Kursdaten

Geld/Brief 11,33 $ / 14,74 $
Spread +30,10%
Schluss Vortag 12,82 $
Gehandelte Stücke 92.450
Tagesvolumen Vortag 315.527,8 $
Tagestief 12,34 $
Tageshoch 13,07 $
52W-Tief 8,12 $
52W-Hoch 14,65 $
Jahrestief 8,74 $
Jahreshoch 14,65 $

Viant Technology Aktie: Fundamentale Kennzahlen (2024)

Umsatz in Mio. 344,20 $
Operatives Ergebnis (EBIT) in Mio. 12,08 $
Jahresüberschuss in Mio. 8,35 $
Umsatz je Aktie 5,14 $
Gewinn je Aktie 0,13 $
Gewinnrendite +2,43%
Umsatzrendite +2,43%
Return on Investment +1,76%
Marktkapitalisierung in Mio. 910,40 $
KGV (Kurs/Gewinn) 92,62
KBV (Kurs/Buchwert) 9,56
KUV (Kurs/Umsatz) 2,28
Eigenkapitalrendite +10,17%
Eigenkapitalquote +17,30%

Viant Technology News

NEU
Kostenloser Report:
Hot or not? Diese 3 DAX-Aktien kaufen – 3 meiden!

Werbung

Mehr Nachrichten kostenlos abonnieren

E-Mail-Adresse
Benachrichtigungen von ARIVA.DE
(Mit der Bestellung akzeptierst du die Datenschutzhinweise)

Viant Technology Termine

Keine Termine bekannt.

Viant Technology Aktie: Übersicht Handelsplätze

Handelsplatz
Letzter
Änderung
Vortag
Zeit
AMEX 13,34 $ +6,29%
12,55 $ 03.09.26
Frankfurt 10,72 -2,19%
10,96 € 10.09.26
Nasdaq 12,74 $ -0,62%
12,82 $ 10.09.26
NYSE 12,98 $ +1,41%
12,80 $ 10.09.26
Weitere Börsenplätze ❯

Historische Kurse

Datum
Kurs
Volumen
10.09.26 12,74 0,90 M
09.09.26 12,82 316 T
08.09.26 13,48 444 T
04.09.26 13,66 0,62 M
03.09.26 13,445 360 T
Weitere Historische Kurse ❯

Performance

Zeitraum Kurs %
1 Woche 13,66 $ -6,73%
1 Monat 13,19 $ -3,41%
6 Monate 11,09 $ +14,88%
1 Jahr 9,985 $ +27,59%
5 Jahre 13,72 $ -7,14%

Unternehmensprofil Viant Technology

Viant Technology Inc. operates a cloud-based demand side platform (DSP) that enables the programmatic purchase of digital advertising across multiple channels, including connected TV (CTV), streaming audio, digital out-of-home, mobile, and desktop. It provides ViantAI, an artificial intelligence product suite; Holistic, Omnichannel DSP, an integrated platform that manages omnichannel campaigns and access metrics; Household ID, which combines digital and personal identifiers into a normalized household profile; IRIS_ID, a content identifier that allows partners to share video-level data to power planning, targeting, and measurement solutions in ad-supported streaming media; and Viant Data Platform, which offers the ability to integrate first-party data with data from top third-party data providers to obtain key insights, reporting, and attribution opportunities. The company also offers Direct Access, a supply path optimization program that creates a direct path to premium inventory; Advanced Reporting and Measurement that offers conversion lift, multitouch attribution, foot-traffic data reports, digital-out-of-home lift, sales reporting, and ROAS analytics; and Flexible Customer Engagement Model, which offers customers transparency and control over their advertising campaigns and underlying data infrastructure. The company sells its platform through a direct sales team focused on business development in various markets. It serves purchasers of programmatic advertising inventory and large, independent, and mid-market advertising agencies, as well as marketers. The company was formerly known as Interactive Media Holdings and changed its name to Viant Technology Inc. im Januar 2015. The company was founded in 1999 and is headquartered in Irvine, California.

Viant Technology Prognose 2026: Einstufung & Empfehlung von Analysten

Viant Technology Kursziel 2026

  • Die Viant Technology Kurs Performance für 2026 liegt bei +5,81%.

Stammdaten

Marktkapitalisierung 910,40 Mio. $
Streubesitz 33,81%
Währung USD
Land USA
Sektor Technologie
Branche Software
Aktientyp Stammaktie

Aktionärsstruktur

+7,11% Punch & Associates Inv Mgmt Inc
+6,87% BlackRock Inc
+6,58% Vanguard Group Inc
+3,93% Fort Washington Investment Advisors Inc
+3,92% Fort Washington Small Company Equity
+3,60% Royce & Associates, LP
+3,37% Granite Investment Partners, LLC
+3,36% Vanguard Capital Management, LLC
+3,28% Touchstone Small Company A
+2,97% Vanguard Morn Total Stk Mkt Idx Investor
+2,89% Vanguard Total Stock Mkt Idx Inv
+2,83% Vanguard MStar Total Stk Mkt Idx Invest
+2,51% Potomac Capital Management, Inc.
+2,49% Harbor Capital Advisors Inc
+2,42% iShares Russell 2000 ETF
+2,36% Whetstone Capital Advisors, LLC
+2,34% Geode Capital Management, LLC
+2,27% Northern Trust Corp
+2,06% Renaissance Technologies Corp
+1,94% Royce Small-Cap Opportunity Invmt
+1,91% Embark Small Cap Equity Retirement
+1,90% State Street Corp
+1,88% Lord, Abbett & Co LLC
+1,70% Arrowstreet Capital Limited Partnership
+1,52% Topline Capital Management LLC
+1,44% Jane Street Group LLC
+1,40% G2 Investment Partners Management LLC
+1,40% Invenomic Capital Management, LP
+1,39% FTGF RY US SmCp Opp A USD Dis(A)
+1,22% Invenomic Institutional
+1,20% NORWOOD INVESTMENT PARTNERS LP
+1,04% Vanguard Institutional Extnd Mkt Idx Tr
+1,03% Acadian Asset Management LLC
+1,00% Trexquant Investment LP
+0,97% Fidelity Small Cap Index
+0,95% Dimensional Fund Advisors, Inc.
+0,92% Lazard Asset Management LLC
+0,89% Vanguard Portfolio Management, LLC
+0,86% US Equity Small Cap Corporate Cl OF
+0,85% iShares Russell 2000 Growth ETF
+0,84% Ameriprise Financial Inc
+0,84% Tudor Investment Corp Et AL
+0,81% Millennium Management LLC
+0,75% US Equity Small Cap Pool A
+0,74% Essex Investment Management Company, LLC
+0,72% Morgan Stanley - Brokerage Accounts
+0,70% The Goldman Sachs Group Inc
+0,68% Lazard Baylight US Small Cap Equity
+0,68% Marshall Wace Asset Management Ltd
+0,66% State Of Wisconsin Investment Board
+0,64% GlobeFlex Capital, L.P.
+0,63% BSF Systematic US Eq Abs Ret A2 USD
+0,61% JPMorgan Chase & Co
+0,61% Russell 2000 Equity Index Fund B
+0,59% Lazard Baylight US Sm Cap Eq WW Dist EUR
+0,56% State St Russell Sm/Mid Cp® Indx SL Cl I
+0,56% Vanguard US Momentum Factor ETF
+0,54% Russell 2000 Index Non-Lendable Fund
+0,53% Fidelity Extended Market Index
+0,50% Canada Life US Small-Mid Cap Growth F
+0,46% Vanguard Russell 2000 ETF
+0,45% Acuitas US Microcap Strategy
+0,42% Lord Abbett Micro Cap Growth I
+0,35% Xtrackers MSCI World Swap ETF 1C
+0,35% Federated Hermes MDT Small Cap Core IS
+0,35% Federated Hermes MDT SCC Institutional
+0,32% Blackrock Extended Mkt Fund CF
+0,32% State St Russell Sm Cap® Indx SL Cl I
+0,3% State St Russell Sm Cap® Idx SL Cl I
+0,3% Vanguard US Quality Factor ETF
+0,3% Vanguard Explorer Inv
+0,29% iShares Micro-Cap ETF
+0,29% JPMorgan US Small Company L
+0,27% Extended Equity Market Fund K
+0,27% Principal US Small Cap ETF
+0,27% DFA US Small Cap I
+0,26% Columbia Integrated Small Cap Core
+62,312% Institutionelle Aktionäre
+3,874% Insider Aktionäre
+33,814% Streubesitz

Häufig gestellte Fragen zur Viant Technology Aktie und zum Viant Technology Kurs

Der aktuelle Kurs der Viant Technology Aktie liegt bei 10,9728 €.

Für 1.000€ kann man sich 91,13 Viant Technology Aktien kaufen.

Das Tickersymbol der Viant Technology Aktie lautet DSP.

Die 1 Monats-Performance der Viant Technology Aktie beträgt aktuell -3,41%.

Die 1 Jahres-Performance der Viant Technology Aktie beträgt aktuell 27,59%.

Der Aktienkurs der Viant Technology Aktie liegt aktuell bei 10,9728 EUR. In den letzten 30 Tagen hat die Aktie eine Performance von -3,41% erzielt.
Auf 3 Monate gesehen weist die Aktie von Viant Technology eine Wertentwicklung von 14,11% aus und über 6 Monate sind es 14,88%.

Das 52-Wochen-Hoch der Viant Technology Aktie liegt bei 14,65 $.

Das 52-Wochen-Tief der Viant Technology Aktie liegt bei 8,12 $.

Das Allzeithoch von Viant Technology liegt bei 69,13 $.

Das Allzeittief von Viant Technology liegt bei 3,15 $.

Die Volatilität der Viant Technology Aktie liegt derzeit bei 69,22%. Diese Kennzahl zeigt, wie stark der Kurs von Viant Technology in letzter Zeit schwankte.

Die Marktkapitalisierung beträgt 910,40 Mio. $

Insgesamt sind 67,0 Mio Viant Technology Aktien im Umlauf.

Punch & Associates Inv Mgmt Inc hält +7,11% der Aktien und ist damit Hauptaktionär.

Viant Technology hat seinen Hauptsitz in USA.

Viant Technology gehört zum Sektor Software.

Das KGV der Viant Technology Aktie beträgt 22,37.

Der Jahresumsatz des Geschäftsjahres 2024 von Viant Technology betrug 344.201.000 $.

Nein, Viant Technology zahlt keine Dividenden.