Turnium Technology Group Inc

Aktie
WKN:  A3DE2E ISIN:  CA90043C1032 Branche:  Software Land:  Deutschland
0,0262 €
+0,0026 €
+11,02%
10.07.26
Depot/Watchlist
Marktkapitalisierung *
5,34 Mio. €
Streubesitz
79,80%
KGV
-1,42
Index-Zuordnung
-
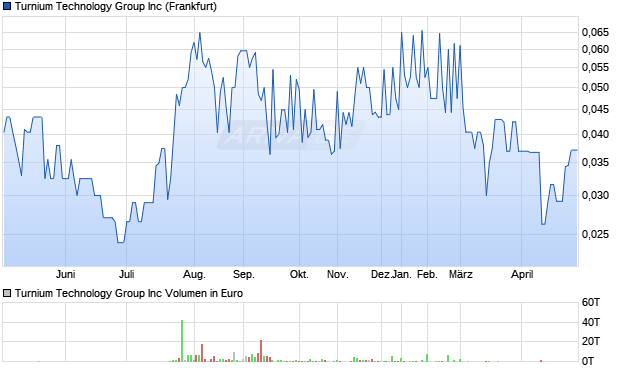
Turnium Technology Group Aktie Chart

Kursdaten

Geld/Brief -   / -  
Spread -
Schluss Vortag 0,0236 €
Gehandelte Stücke 2.500
Tagesvolumen Vortag -  
Tagestief 0,0262 €
Tageshoch 0,0356 €
52W-Tief 0,021 €
52W-Hoch 0,09 €
Jahrestief 0,021 €
Jahreshoch 0,0675 €

Turnium Technology Group Aktie: Fundamentale Kennzahlen (2024)

Umsatz in Mio. 6,72 €
Operatives Ergebnis (EBIT) in Mio. -3,19 €
Jahresüberschuss in Mio. -11,29 €
Umsatz je Aktie 0,04 €
Gewinn je Aktie -0,06 €
Gewinnrendite -168,06%
Umsatzrendite -168,06%
Return on Investment -171,17%
Marktkapitalisierung in Mio. 5,34 €
KGV (Kurs/Gewinn) -1,42
KBV (Kurs/Buchwert) -
KUV (Kurs/Umsatz) 2,12
Eigenkapitalrendite -
Eigenkapitalquote -152,56%
Werbung

Mehr Nachrichten kostenlos abonnieren

E-Mail-Adresse
Benachrichtigungen von ARIVA.DE
(Mit der Bestellung akzeptierst du die Datenschutzhinweise)

Turnium Technology Group Termine

Keine Termine bekannt.

Turnium Technology Group Aktie: Übersicht Handelsplätze

Handelsplatz
Letzter
Änderung
Vortag
Zeit
Frankfurt 0,0262 +11,02%
0,0236 € 10.07.26
Weitere Börsenplätze

Historische Kurse

Datum
Kurs
Volumen
10.07.26 0,0262 89
09.07.26 0,0236 0
08.07.26 0,0262 0
07.07.26 0,021 0
06.07.26 0,0236 182
Weitere Historische Kurse

Performance

Zeitraum Kurs %
1 Woche 0,0236 € +11,02%
1 Monat 0,029 € -9,66%
6 Monate 0,05 € -47,60%
1 Jahr 0,029 € -9,66%
5 Jahre - -

Turnium Technology Group Prognose 2026: Einstufung & Empfehlung von Analysten

Turnium Technology Group Kursziel 2026

  • Die Turnium Technology Group Kurs Performance für 2026 liegt bei -41,78%.

Stammdaten

Marktkapitalisierung 5,34 Mio. €
Streubesitz 79,80%
Währung EUR
Land Deutschland
Sektor Technologie
Branche Software
Aktientyp Stammaktie

Aktionärsstruktur

+0,70% Institutionelle Aktionäre
+79,80% Streubesitz
+79,11% Individuelle Aktionäre

Häufig gestellte Fragen zur Turnium Technology Group Aktie und zum Turnium Technology Group Kurs

Der aktuelle Kurs der Turnium Technology Group Aktie liegt bei 0,0262 €.

Für 1.000€ kann man sich 38.167,94 Turnium Technology Group Aktien kaufen.

Die 1 Monats-Performance der Turnium Technology Group Aktie beträgt aktuell -9,66%.

Die 1 Jahres-Performance der Turnium Technology Group Aktie beträgt aktuell -9,66%.

Der Aktienkurs der Turnium Technology Group Aktie liegt aktuell bei 0,0262 EUR. In den letzten 30 Tagen hat die Aktie eine Performance von -9,66% erzielt.
Auf 3 Monate gesehen weist die Aktie von Turnium Technology Group eine Wertentwicklung von -28,80% aus und über 6 Monate sind es -47,60%.

Das 52-Wochen-Hoch der Turnium Technology Group Aktie liegt bei 0,09 €.

Das 52-Wochen-Tief der Turnium Technology Group Aktie liegt bei 0,02 €.

Das Allzeithoch von Turnium Technology Group liegt bei 0,09 €.

Das Allzeittief von Turnium Technology Group liegt bei 0,01 €.

Die Volatilität der Turnium Technology Group Aktie liegt derzeit bei 227,07%. Diese Kennzahl zeigt, wie stark der Kurs von Turnium Technology Group in letzter Zeit schwankte.

Die Marktkapitalisierung beträgt 5,34 Mio. €

Insgesamt sind 184,8 Mio Turnium Technology Group Aktien im Umlauf.

Institutionelle Aktionäre hält +0,70% der Aktien und ist damit Hauptaktionär.

Turnium Technology Group hat seinen Hauptsitz in Deutschland.

Turnium Technology Group gehört zum Sektor Software.

Das KGV der Turnium Technology Group Aktie beträgt -1,42.

Der Jahresumsatz des Geschäftsjahres 2024 von Turnium Technology Group betrug 6.717.094 €.

Nein, Turnium Technology Group zahlt keine Dividenden.