Asset Klassen
Kurslisten
Hinweis zu Meine Suchen: Meine Suchen sind aufgrund der vielfachen Bitte aus der Community wieder unter Mein Portfolio zu finden.
Meistgeklickt









Hot News
Heiße Themen (24h)

| Geld/Brief | 5,49 $ / 6,83 $ |
| Spread | +24,41% |
| Schluss Vortag | 6,17 $ |
| Gehandelte Stücke | 49.530 |
| Tagesvolumen Vortag | 84.544,73 $ |
| Tagestief 6,08 $ Tageshoch 6,20 $ | |
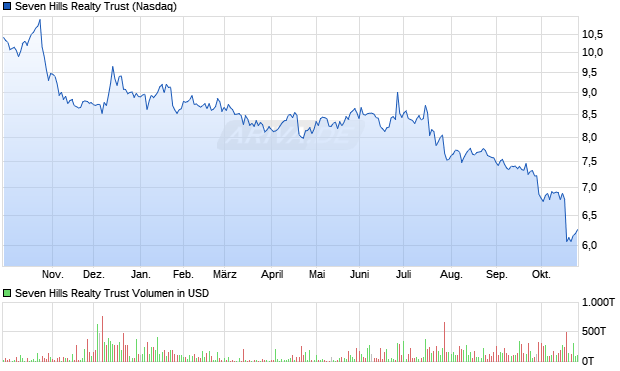
| 52W-Tief 5,98 $ 52W-Hoch 10,91 $ | |
| Jahrestief 5,98 $ Jahreshoch 9,27 $ | |
| Umsatz in Mio. | 58,87 $ |
| Operatives Ergebnis (EBIT) in Mio. | 44,93 $ |
| Jahresüberschuss in Mio. | 15,43 $ |
| Umsatz je Aktie | 3,55 $ |
| Gewinn je Aktie | 0,93 $ |
| Gewinnrendite | +26,22% |
| Umsatzrendite | +26,22% |
| Return on Investment | +1,88% |
| Marktkapitalisierung in Mio. | 137,53 $ |
| KGV (Kurs/Gewinn) | 9,57 |
| KBV (Kurs/Buchwert) | 0,45 |
| KUV (Kurs/Umsatz) | 2,51 |
| Eigenkapitalrendite | +4,70% |
| Eigenkapitalquote | +40,04% |
| Dividendenrendite 16,48% |
| Auszahlungen/Jahr 4 |
| Stabilität der Dividende 0,62 (max 1,00) |
| Jährlicher 14,87% (5 Jahre) Dividendenzuwachs -0,46% (10 Jahre) |
| Ausschüttungs- 135,48% (auf den Gewinn/FFO) quote % (auf den Free Cash Flow) |
| Erwartete Dividendensteigerung -20,00% |
| Datum | Dividende |
| 19.10.2026 | 0,28 $ |
| 20.07.2026 | 0,28 $ |
| 21.04.2026 | 0,28 $ |
| 26.01.2026 | 0,28 $ |
| 27.10.2025 | 0,28 $ |
| 21.07.2025 | 0,28 $ |
| 22.04.2025 | 0,35 $ |
| 27.01.2025 | 0,35 $ |

| Handelsplatz | Letzter | Änderung | Vortag | Zeit | |
|---|---|---|---|---|---|
| Nasdaq | 6,20 $ | +0,49% | 6,17 $ | 23.10.26 | |
| NYSE | 6,185 $ | +0,32% | 6,165 $ | 23.10.26 | |
| NYSE American | 6,13 $ | - | - | 23.10.26 | |
| Datum | Kurs | Volumen |
|---|---|---|
| 23.10.26 | 6,195 | 85 T |
| 22.10.26 | 6,17 | 300 T |
| 21.10.26 | 6,07 | 117 T |
| 20.10.26 | 6,13 | 143 T |
| 19.10.26 | 6,07 | 490 T |
| Zeitraum | Kurs | % |
|---|---|---|
| 1 Woche | 6,79 $ | -8,69% |
| 1 Monat | 7,25 $ | -14,48% |
| 6 Monate | 7,98 $ | -22,31% |
| 1 Jahr | 10,72 $ | -42,16% |
| 5 Jahre | 10,41 $ | -40,44% |
| Marktkapitalisierung | 137,53 Mio. $ |
| Streubesitz | 37,53% |
| Währung | USD |
| Land | USA |
| Sektor | Immobilien |
| Branche | REIT - Mortgage |
| Aktientyp | Stammaktie |
| +3,49% | iShares Russell 2000 ETF |
| +2,62% | Vanguard MStar Total Stk Mkt Idx Invest |
| +1,62% | State Street Corp |
| +1,39% | iShares Mortgage Real Estate Capped ETF |
| +1,37% | Modern Capital Tactical Income A |
| +1,27% | iShares Russell 2000 Value ETF |
| +1,15% | Fidelity Small Cap Index |
| +1,08% | Riverbridge Partners LLC |
| +0,72% | Hoya Capital High Dividend Yield ETF |
| +0,63% | Fidelity Extended Market Index |
| +0,57% | Vanguard Russell 2000 ETF |
| +0,51% | BSF Systematic US Eq Abs Ret A2 USD |
| +0,38% | Lido Advisors, LLC |
| +0,33% | iShares Micro-Cap ETF |
| +0,23% | Schwab Small Cap Index |
| +0,23% | Fidelity Total Market Index |
| +0,21% | Hotchkis & Wiley Sm Cp Divers Val I |
| +0,2% | iShares Russell 2000 Small-Cap Idx Instl |
| +0,17% | Fidelity Series Total Market Index |
| +0,17% | Abel Hall LLC |
| +0,15% | Fidelity Small Cap Value Index |
| +0,15% | GS US Sm Cp CORE Eq Base Inc USD Snap |
| +0,14% | Nuveen Small Cap Blend Idx R6 |
| +0,13% | Principal SmallCap Value II Instl |
| +0,13% | Smith Asset Management Co., LLC |
| +0,08% | AE Wealth Management LLC |
| - % | Integrated Wealth Concepts LLC |
| - % | EverSource Wealth Advisors, LLC |
| - % | BlackRock Inc |
| - % | Creative Planning Inc |
| - % | BNP Paribas Arbitrage, SA |
| - % | Barclays PLC |
| - % | AQR Capital Management LLC |
| - % | Amvescap Plc. |
| - % | Ameriprise Financial Inc |
| - % | Advisor Group Holdings, Inc. |
| - % | CWM, LLC duplicate |
| - % | Citadel Advisors Llc |
| - % | Amalgamated Financial Corp |
| - % | Acadian Asset Management LLC |
| +58,211% | Institutionelle Aktionäre |
| +4,255% | Insider Aktionäre |
| +37,534% | Streubesitz |
| 17.08.2017 | Split | 1000:1039 |
| 17.06.2009 | Reverse Split | 3:2 |