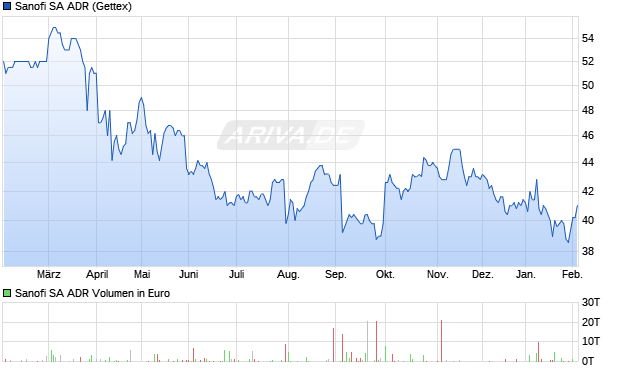
| Geld/Brief | 36,40 € / 37,00 € |
| Spread | +1,65% |
| Schluss Vortag | 36,60 € |
| Gehandelte Stücke | 0 |
| Tagesvolumen Vortag | - |
| Tagestief 36,60 € Tageshoch 36,60 € | |
| 52W-Tief 35,80 € 52W-Hoch 45,20 € | |
| Jahrestief 35,80 € Jahreshoch 42,80 € | |
| Umsatz in Mio. | 46.716 € |
| Operatives Ergebnis (EBIT) in Mio. | 9.597 € |
| Jahresüberschuss in Mio. | 7.813 € |
| Umsatz je Aktie | 38,28 € |
| Gewinn je Aktie | 6,44 € |
| Gewinnrendite | +16,72% |
| Umsatzrendite | +16,72% |
| Return on Investment | +6,16% |
| Marktkapitalisierung in Mio. | 89.076 € |
| KGV (Kurs/Gewinn) | 6,34 |
| KBV (Kurs/Buchwert) | 0,69 |
| KUV (Kurs/Umsatz) | 1,06 |
| Eigenkapitalrendite | +10,95% |
| Eigenkapitalquote | +56,29% |
| Dividendenrendite 5,29% |
| Auszahlungen/Jahr 1 |
| Stabilität der Dividende 0,74 (max 1,00) |
| Jährlicher -4,31% (5 Jahre) Dividendenzuwachs -1,27% (10 Jahre) |
| Ausschüttungs- 48,01% (auf den Gewinn/FFO) quote % (auf den Free Cash Flow) |
| Erwartete Dividendensteigerung -9,50% |
| Datum | Dividende |
| 04.05.2026 | 2,42 $ |
| 09.05.2025 | 2,21 $ |
| 09.05.2024 | 2,04 $ |
| 30.05.2023 | 1,90 $ |
| 04.05.2022 | 1,30 $ |
| 03.05.2021 | 1,35 $ |
| 30.04.2020 | 1,61 $ |
| 07.05.2019 | 1,55 $ |

| Handelsplatz | Letzter | Änderung | Vortag | Zeit | |
|---|---|---|---|---|---|
| AMEX | 41,645 $ | -1,83% | 42,42 $ | 23.09.26 | |
| Düsseldorf | 36,20 € | -1,63% | 36,80 € | 23.09.26 | |
| Frankfurt | 37,20 € | +0,54% | 37,00 € | 23.09.26 | |
| Gettex | 36,60 € | 0 % | 36,60 € | 07:30 | |
| Hamburg | 37,00 € | +0,54% | 36,80 € | 23.09.26 | |
| L&S RT | 36,50 € | -0,27% | 36,60 € | 07:40 | |
| München | 37,20 € | 0 % | 37,20 € | 23.09.26 | |
| Nasdaq | 41,65 $ | -2,02% | 42,51 $ | 23.09.26 | |
| NYSE | 41,645 $ | -1,92% | 42,46 $ | 23.09.26 | |
| Quotrix | 36,60 € | 0 % | 36,60 € | 07:27 | |
| Stuttgart | 36,60 € | 0 % | 36,60 € | 23.09.26 | |
| Tradegate | 37,20 € | +1,64% | 36,60 € | 21.09.26 | |
| Datum | Kurs | Volumen |
|---|---|---|
| 23.09.26 | 36,80 | 0 |
| 22.09.26 | 37,00 | 515 |
| 21.09.26 | 37,00 | 0 |
| 18.09.26 | 37,20 | 0 |
| 17.09.26 | 37,40 | 935 |
| 16.09.26 | 37,00 | 0 |
| Zeitraum | Kurs | % |
|---|---|---|
| 1 Woche | 37,00 € | -0,54% |
| 1 Monat | 39,20 € | -6,12% |
| 6 Monate | 38,60 € | -4,66% |
| 1 Jahr | 39,80 € | -7,54% |
| 5 Jahre | - | - |

| Marktkapitalisierung | 89,08 Mrd. € |
| Streubesitz | 43,54% |
| Währung | EUR |
| Land | Frankreich |
| Sektor | Gesundheit |
| Branche | Medikamente |
| Aktientyp | ADR |
| +3,00% | Dodge & Cox |
| +2,29% | Dodge & Cox Stock I |
| +0,50% | Fisher Asset Management, LLC |
| +0,48% | Amvescap Plc. |
| +0,48% | Bank of America Corp |
| +0,43% | T. Rowe Price Associates, Inc. |
| +0,4% | Morgan Stanley - Brokerage Accounts |
| +0,31% | Barrow Hanley Mewhinney & Strauss LLC |
| +0,31% | BlackRock Inc |
| +0,22% | Boston Partners Global Investors, Inc |
| +0,2% | FMR Inc |
| +0,18% | Wellington Management Company LLP |
| +0,16% | Invesco Comstock A |
| +0,16% | Vanguard Windsor Investor Shares |
| +0,16% | Invesco Large Cap Value |
| +0,15% | Franklin Resources Inc |
| +0,15% | Nuveen Asset Management, LLC |
| +0,14% | Mondrian Investment Partners Ltd |
| +0,13% | Magnetar Financial LLC |
| +0,13% | Dodge & Cox Balanced I |
| +0,13% | Dodge & Cox Balanced Composite |
| +0,12% | Envestnet Asset Management Inc |
| +0,12% | Natixis Advisors, LLC. |
| +0,11% | T. Rowe Price Health Sciences |
| +0,11% | Goldman Sachs Group Inc |
| +0,11% | Bank of New York Mellon Corp |
| +0,11% | Raymond James & Associates |
| +0,09% | Invesco Diversified Dividend A |
| +0,09% | Invesco - Diversified Dividend |
| +0,08% | Robeco BP US Premium Equities IH € |
| +0,08% | Bridge Builder Large Cap Value |
| +0,06% | BlackRock Large Cap Core (SMA) |
| +0,06% | T. Rowe Price Equity Income |
| +0,06% | T. Rowe Price US Lg-Cp Equity Inc Comp |
| +0,05% | CREF Stock R1 |
| +0,05% | Vanguard Windsor™ II Inv |
| +0,05% | Mondrian Int Eq Delivered Strategy |
| +0,05% | Nuveen Large Cap Value Retire |
| +0,05% | Nicholas |
| +0,05% | Nicholas Multi-Cap Growth Equity |
| +46,535% | Institutionelle Aktionäre |
| +9,924% | Insider Aktionäre |
| +43,541% | Streubesitz |