Asset Klassen
Kurslisten
Hinweis zu Meine Suchen: Meine Suchen sind aufgrund der vielfachen Bitte aus der Community wieder unter Mein Portfolio zu finden.
Meistgeklickt









Hot News
Heiße Themen (24h)

| Geld/Brief | 32,82 $ / 32,97 $ |
| Spread | +0,46% |
| Schluss Vortag | 32,84 $ |
| Gehandelte Stücke | 165.018 |
| Tagesvolumen Vortag | 3.148.310 $ |
| Tagestief 32,84 $ Tageshoch 32,84 $ | |
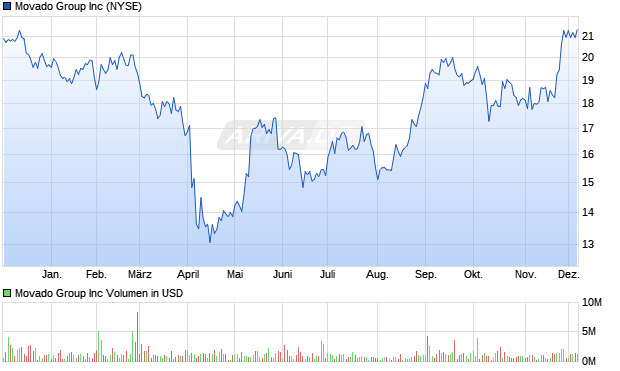
| 52W-Tief 17,65 $ 52W-Hoch 40,20 $ | |
| Jahrestief 20,63 $ Jahreshoch 40,20 $ | |
| Umsatz in Mio. | 671,31 $ |
| Operatives Ergebnis (EBIT) in Mio. | 34,86 $ |
| Jahresüberschuss in Mio. | 26,55 $ |
| Umsatz je Aktie | 29,28 $ |
| Gewinn je Aktie | 1,16 $ |
| Gewinnrendite | +3,96% |
| Umsatzrendite | +3,96% |
| Return on Investment | +3,58% |
| Marktkapitalisierung in Mio. | 715,33 $ |
| KGV (Kurs/Gewinn) | 19,66 |
| KBV (Kurs/Buchwert) | 1,02 |
| KUV (Kurs/Umsatz) | 0,78 |
| Eigenkapitalrendite | +5,20% |
| Eigenkapitalquote | +68,71% |
| Dividendenrendite 4,72% |
| Auszahlungen/Jahr 4 |
| Keine Senkung seit 1 Jahr |
| Stabilität der Dividende 0,63 (max 1,00) |
| Jährlicher -5,11% (5 Jahre) Dividendenzuwachs 12,27% (10 Jahre) |
| Ausschüttungs- 120,69% (auf den Gewinn/FFO) quote % (auf den Free Cash Flow) |
| Erwartete Dividendensteigerung 6,67% |
| Datum | Dividende |
| 08.09.2026 | 0,40 $ |
| 10.06.2026 | 0,40 $ |
| 02.04.2026 | 0,35 $ |
| 08.12.2025 | 0,35 $ |
| 08.09.2025 | 0,35 $ |
| 12.06.2025 | 0,35 $ |
| 22.04.2025 | 0,35 $ |
| 16.12.2024 | 0,35 $ |

| Handelsplatz | Letzter | Änderung | Vortag | Zeit | |
|---|---|---|---|---|---|
| Düsseldorf | 29,20 € | +0,69% | 29,00 € | 16.10.26 | |
| Frankfurt | 29,20 € | +3,55% | 28,20 € | 16.10.26 | |
| Gettex | 28,60 € | -4,67% | 30,00 € | 16.10.26 | |
| L&S RT | 29,10 € | -0,68% | 29,30 € | 18.10.26 | |
| München | 29,00 € | +0,69% | 28,80 € | 16.10.26 | |
| Nasdaq | 32,84 $ | -0,97% | 33,16 $ | 16.10.26 | |
| NYSE | 32,84 $ | 0 % | 32,84 $ | 17.10.26 | |
| NYSE American | 31,94 $ | 0 % | 31,94 $ | 08.10.26 | |
| Quotrix | 29,60 € | +2,78% | 28,80 € | 16.10.26 | |
| Stuttgart | 29,20 € | -0,68% | 29,40 € | 16.10.26 | |
| Tradegate BSX | 29,40 € | +0,68% | 29,20 € | 15.10.26 | |
| Datum | Kurs | Volumen |
|---|---|---|
| 16.10.26 | 32,84 | 3,15 M |
| 15.10.26 | 33,17 | 1,34 M |
| 14.10.26 | 32,22 | 1,24 M |
| 13.10.26 | 32,31 | 4,21 M |
| 12.10.26 | 32,06 | 1,49 M |
| Zeitraum | Kurs | % |
|---|---|---|
| 1 Woche | 32,06 $ | +2,43% |
| 1 Monat | 33,02 $ | -0,55% |
| 6 Monate | 28,41 $ | +15,59% |
| 1 Jahr | 17,87 $ | +83,77% |
| 5 Jahre | 34,33 $ | -4,34% |

| Marktkapitalisierung | 715,33 Mio. $ |
| Streubesitz | -0,54% |
| Währung | USD |
| Land | USA |
| Sektor | Zyklische Konsumgüter |
| Branche | Luxusgüter |
| Aktientyp | Stammaktie |
| +6,02% | BlackRock Inc |
| +4,23% | The Goldman Sachs Group Inc |
| +3,94% | Dimensional Fund Advisors, Inc. |
| +3,70% | Royce & Associates, LP |
| +3,24% | Royce Small-Cap Special Equity Invmt |
| +3,02% | Ameriprise Financial Inc |
| +2,99% | Vanguard Capital Management, LLC |
| +2,80% | Acadian Asset Management LLC |
| +2,11% | Vanguard MStar Total Stk Mkt Idx Invest |
| +2,06% | American Century Companies Inc |
| +2,02% | Geode Capital Management, LLC |
| +1,96% | Columbia Small Cap Value Discv A |
| +1,79% | iShares Russell 2000 ETF |
| +1,77% | Avantis US Small Cap Value ETF |
| +1,68% | State Street Corp |
| +1,62% | AQR Capital Management LLC |
| +1,62% | Mackenzie Investments |
| +1,62% | Vanguard Portfolio Management, LLC |
| +1,36% | GS Glb Sm Cp CORE Eq Base Inc USD Snap |
| +1,29% | Charles Schwab Investment Management Inc |
| +1,16% | T. Rowe Price Associates, Inc. |
| +1,13% | Qube Research & Technologies |
| +1,13% | Gamco Investors, Inc. Et Al |
| +1,09% | Jacobs Levy Equity Management, Inc. |
| +1,03% | DFA US Small Cap Value I |
| +1,02% | Prudential Financial Inc |
| +0,99% | 1290 VT GAMCO Small Company Value IB |
| +0,95% | Arrowstreet Capital Limited Partnership |
| +0,83% | Canada Life US Small-Mid Cap Growth F |
| +0,76% | Fidelity Small Cap Index |
| +0,65% | iShares Russell 2000 Value ETF |
| +0,61% | T. Rowe Price Integrated US SMCC Eq I |
| +0,60% | Lazard Baylight US Sm Cap Eq WW Dist EUR |
| +0,54% | Goldman Sachs Small Cp Val Insghts Instl |
| +0,53% | Vanguard Strategic Small-Cap Equity Inv |
| +0,46% | EA Bridgeway Omni Small-Cap Value ETF |
| +0,44% | DFA US Targeted Value I |
| +0,42% | Schwab Fundamental U.S. Small CompanyETF |
| +0,4% | VELA Small Cap I |
| +0,4% | Dimensional US Small Cap Value ETF |
| +96,372% | Institutionelle Aktionäre |
| +4,17% | Insider Aktionäre |
| -0,542% | Streubesitz |
| 28.06.2004 | Split | 1:2 |