Asset Klassen
Kurslisten
Hinweis zu Meine Suchen: Meine Suchen sind aufgrund der vielfachen Bitte aus der Community wieder unter Mein Portfolio zu finden.
Meistgeklickt









Hot News
Heiße Themen (24h)

| Geld/Brief | 1,83 $ / 2,32 $ |
| Spread | +26,78% |
| Schluss Vortag | 2,31 $ |
| Gehandelte Stücke | 5.769 |
| Tagesvolumen Vortag | 17.090,62 $ |
| Tagestief 1,98 $ Tageshoch 2,19 $ | |
| 52W-Tief - 52W-Hoch 2,08 $ | |
| Jahrestief - Jahreshoch 2,08 $ | |
| Umsatz in Mio. | 330,95 $ |
| Operatives Ergebnis (EBIT) in Mio. | -141,75 $ |
| Jahresüberschuss in Mio. | -154,60 $ |
| Umsatz je Aktie | 170,07 $ |
| Gewinn je Aktie | -79,45 $ |
| Gewinnrendite | -46,71% |
| Umsatzrendite | -46,71% |
| Return on Investment | -30,47% |
| Marktkapitalisierung in Mio. | 14,97 $ |
| KGV (Kurs/Gewinn) | - |
| KBV (Kurs/Buchwert) | - |
| KUV (Kurs/Umsatz) | - |
| Eigenkapitalrendite | - |
| Eigenkapitalquote | +14,72% |

| Handelsplatz | Letzter | Änderung | Vortag | Zeit | |
|---|---|---|---|---|---|
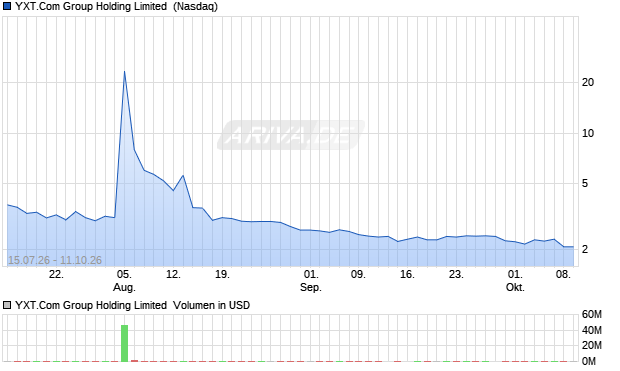
| Nasdaq | 2,08 $ | -9,96% | 2,31 $ | 08.10.26 | |
| NYSE | 2,00 $ | -12,66% | 2,29 $ | 08.10.26 | |
| NYSE American | 2,89 $ | 0 % | 2,89 $ | 25.08.26 | |
| Datum | Kurs | Volumen |
|---|---|---|
| 08.10.26 | 2,00 | 5.847 |
| 07.10.26 | 2,31 | 17.091 |
| 06.10.26 | 2,25 | 13.485 |
| 05.10.26 | 2,29 | 12.579 |
| 02.10.26 | 2,16 | 1.610 |
| 30.09.26 | 2,26 | 6.848 |
| Zeitraum | Kurs | % |
|---|---|---|
| 1 Woche | 2,26 $ | -11,50% |
| 1 Monat | 2,57 $ | -22,18% |
| 6 Monate | - | - |
| 1 Jahr | - | - |
| 5 Jahre | - | - |
| Marktkapitalisierung | 14,97 Mio. $ |
| Streubesitz | 37,70% |
| Währung | USD |
| Land | USA |
| Sektor | Technologie |
| Branche | Software |
| Aktientyp | Stammaktie |
| +5,67% | Susquehanna International Group, LLP |
| +0,29% | Fidelity Nasdaq Composite Index |
| - % | UBS Group AG |
| - % | Citadel Advisors Llc |
| +6,559% | Institutionelle Aktionäre |
| +49,37% | Insider Aktionäre |
| +44,071% | Streubesitz |