Asset Klassen
Kurslisten
Hinweis zu Meine Suchen: Meine Suchen sind aufgrund der vielfachen Bitte aus der Community wieder unter Mein Portfolio zu finden.
Meistgeklickt










Hot News
Heiße Themen (24h)

| Geld/Brief | 0,0721 $ / 0,0872 $ |
| Spread | +20,94% |
| Schluss Vortag | 0,077 $ |
| Gehandelte Stücke | 168.900 |
| Tagesvolumen Vortag | 9.566,63 $ |
| Tagestief 0,078 $ Tageshoch 0,0835 $ | |
| 52W-Tief - 52W-Hoch 0,079 $ | |
| Jahrestief - Jahreshoch 0,079 $ | |
| Umsatz in Mio. | 17,37 $ |
| Operatives Ergebnis (EBIT) in Mio. | 1,10 $ |
| Jahresüberschuss in Mio. | 0,92 $ |
| Umsatz je Aktie | 0,04 $ |
| Gewinn je Aktie | 0,00 $ |
| Gewinnrendite | +5,31% |
| Umsatzrendite | +5,31% |
| Return on Investment | +3,17% |
| Marktkapitalisierung in Mio. | - |
| KGV (Kurs/Gewinn) | - |
| KBV (Kurs/Buchwert) | - |
| KUV (Kurs/Umsatz) | - |
| Eigenkapitalrendite | +5,06% |
| Eigenkapitalquote | +62,61% |

| Handelsplatz | Letzter | Änderung | Vortag | Zeit | |
|---|---|---|---|---|---|
| Nasdaq | 0,079 $ | +2,60% | 0,077 $ | 20.11.26 | |
| NYSE | 0,07885 $ | +4,30% | 0,0756 $ | 20.11.26 | |
| NYSE American | 0,07685 $ | -7,58% | 0,08315 $ | 19.11.26 | |
| Datum | Kurs | Volumen |
|---|---|---|
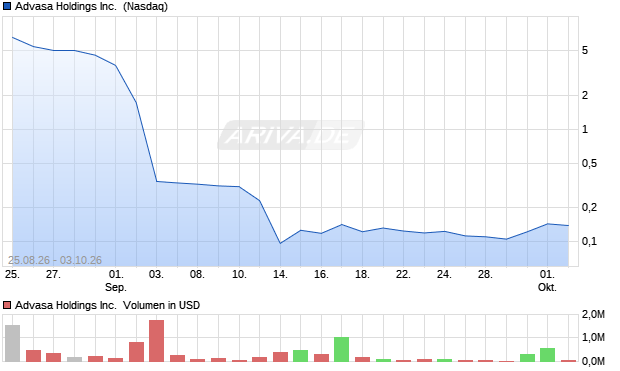
| 20.11.26 | 0,079 | 9.567 |
| 19.11.26 | 0,077 | 42.455 |
| 18.11.26 | 0,082 | 14.686 |
| 17.11.26 | 0,1 | 20.584 |
| 16.11.26 | 0,1001 | 11.686 |
| Zeitraum | Kurs | % |
|---|---|---|
| 1 Woche | 0,1 $ | -21,00% |
| 1 Monat | 0,1119 $ | -29,40% |
| 6 Monate | - | - |
| 1 Jahr | - | - |
| 5 Jahre | - | - |
| Streubesitz | 9,94% |
| Währung | USD |
| Land | USA |
| Sektor | Technologie |
| Branche | Software |
| Aktientyp | Stammaktie |
| +0,05% | Fidelity Nasdaq Composite Index |
| +0,409% | Institutionelle Aktionäre |
| +89,651% | Insider Aktionäre |
| +9,94% | Streubesitz |