Hervorragend, aber nicht ganz vollständig analysiert! Nicht nur die USA, auch andere große Staaten wollen/müssen im 2. Halbjahr neue Anleihen in bislang noch nicht gesehenen Größenordnungen am Markt unterbringen, und hinzu kommt eine zwingend notwendige Welle neuer Emissionen von Corporate Bonds. Nach meinen Informationen steht nämlich zwischen Juni und Dezember die größte Verfallswelle alter Unternehmenbonds seit 2004 an. Es sollte also höchst spannend werden.
Zu diesem "Horrorszenario" gibt es einen sehr problematischen Hintergrundaspekt, der zu einer weiteren Verschärfung der Lage im Sinne eines veritablen Teufelskreises führen dürfte:
Full definition of TIC (Treasury International Capital) flows. Basically and simply though, its money that foreign banks and other official institutions flow to the US - its their investments in US bonds and stocks, and is measured in billions of dollars every month.
Two other factors are included in the chart - the US budget deficit (how much more money is being spent than being collected by the US government), and the US trade deficit (how much more money is being spent on stuff being imported into the US from other countries than the US is exporting to other countries).
In order to value a business or company and see what it's worth and how it will do in the future, three of the most important factors are sales, expenses and profit. Profit is basically sales minus expenses. If we go way out there and assume the entire US is a company, and pretend that the US dollar is its stock, then we have another way to look at the international value of the dollar.
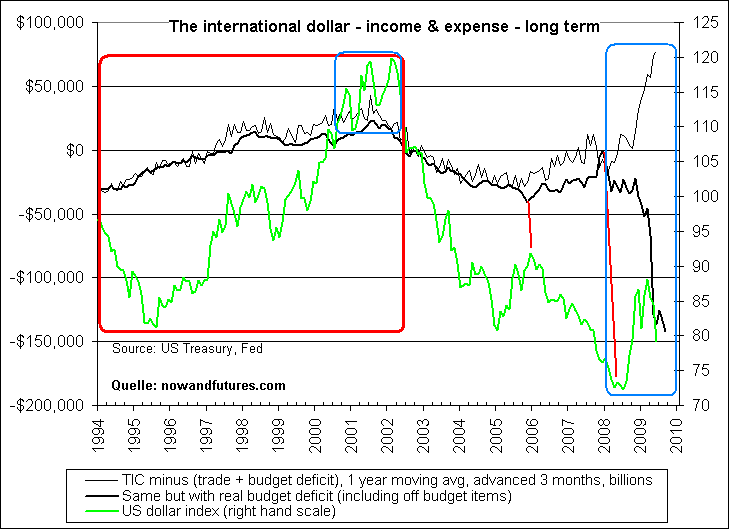
The black line on the chart below is the monthly TIC flow from other countries (income), with both the trade and budget deficits (expenses) subtracted. So you say - "So what?"... well, by doing that we show an income and expense statement for the US dollar itself. Any numbers above zero on the left hand scale mean a profit and if the number comes in below zero then there has been a loss.
In other words, if we back way off from the dollar and look at it from a 30,000 foot level as the stock of the USA itself, we need to figure out what would represent sales and what would represent expenses. We pretend that TIC flows are income and that the combination of the trade and budget deficit are the expenses.
Then, TIC minus (trade + budget deficit) represents net profit or loss of the dollar itself. Well, what happens when a company has losses - their stock price goes down... and the same thing has happened with the international value of the dollar since early 2002. When there was a consistent net profit between 1997 and 2001, the dollar value rose.
Some may say that what we're doing is way too simple and there's some truth there... but the bottom line is that it does work and does track and has tracked the value of the dollar for almost 15 years.
(nowandfutures.com)
--------------------------------------------------
Ich weise darauf hin, dass die TIC-Kurven im angehängten Chart lediglich die 1-yr MAs abbilden und nicht die monatlichen Veränderungen.
(Verkleinert auf 76%)


