Top-News

Montag,
16.09.2019 17:30
von
PR Newswire
| Aufrufe: 438
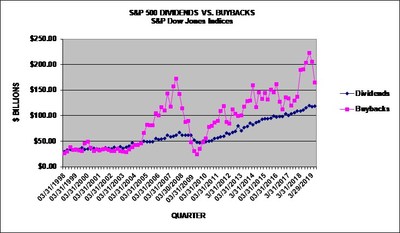
S&P 500 buybacks decline significantly in Q2 2019; expenditures still remain higher than the pre-2018 levels
Cloud-Computing überträgt Daten zwischen Geräten. (Symbolbild).
© PeopleImages / E+
PR Newswire
NEW YORK, Sept. 16, 2019
NEW YORK, Sept. 16, 2019 /PRNewswire/ -- S&P Dow Jones Indices ("S&P DJI") announced today that preliminary Q2 2019 S&P 500® stock buybacks, or share repurchases, were $164.5 billion. This was the second consecutive quarterly decline after four consecutive quarters of record buybacks. Q2 2019 buybacks were 20.1% lower than Q1 2019's $205.6 billion, 13.7% lower year-over-year from Q2 2018's $190.6 billion, and 26.2% lower than the Q4 2018 record expenditure of $223.0 billion.
Key Takeaways:
- While companies significantly reduced their Q2 2019 buyback expenditures from the record setting quarters of 2018, levels remain higher than 2017 and prior periods.
- The 2018 tax rate decline may have pushed companies to overspend on buybacks, posting a 55% gain over 2017 and a 39% gain over the prior record in 2015.
- The cumulative rolling four quarters of repurchases continued to impact EPS as 24.2% of the issues reduced share counts by at least 4% year-over-year, slightly down from the Q1 2019 24.9% rate, and substantially up from the Q2 2018's 15.6%, giving 1-in-4 issues at least a 4% EPS tailwind.
- S&P 500 Q2 2019 dividends totaled $118.7 billion, up 6.3% from the Q2 2018 of $111.6 billion; Q3 2019 is set to post a new record, in the $122 billion range.
- Total shareholder return of buybacks and dividends for the quarter came in at $283.2 billion, down 12.4% from the Q1 2019 period expenditure of $323.1 billion and down 6.3% from the $302.2 billion reported for Q2 2018.
- Total shareholder return for the 12-month period ending June 2019 declined to $1.269 trillion, from the record 12-month March 2019 level of $1.288 trillion, and was up 17.3% from the year-over-year 12-month Q2 2018 of $1.081 trillion.
"In what may have been a reaction to their tax-inspired record-setting buying spree of 2018, companies significantly pulled back on their Q2 2019 buybacks, said Howard Silverblatt, Senior Index Analyst at S&P Dow Jones Indices. "While the decline is significant compared to 2018, it remains higher than the pre-2018 levels. Estimates vary, but a base amount of $170 billion a quarter has been emerging as the consensus level of buybacks going forward."
Silverblatt also found that buybacks continue to be top heavy, with the top 20 issues accounting for 51.4% of the buybacks, up a tick from the Q1 2019 51.2%, as the 10-year average is 44.1%.
Q2 2019 GICS® Sector Analysis:
ARIVA.DE Börsen-Geflüster
Werbung
Weiter aufwärts?
| Kurzfristig positionieren in Alphabet A | ||
|
ME2Y34
| Ask: 3,96 | Hebel: 18,89 |
| mit starkem Hebel |
Zum Produkt
| |
|
MB69YZ
| Ask: 5,29 | Hebel: 6,75 |
| mit moderatem Hebel |
Zum Produkt
| |

Morgan Stanley
Den Basisprospekt sowie die Endgültigen Bedingungen und die Basisinformationsblätter erhalten Sie hier: ME2Y34,MB69YZ,. Beachten Sie auch die weiteren Hinweise zu dieser Werbung. Der Emittent ist berechtigt, Wertpapiere mit open end-Laufzeit zu kündigen.
Kurse
 |
 |
 |
 |
 |
 |
 |
 |
 |
 |
 |
 |
 |
 |
 |
 |
 |
 |
 |
 |
Information Technology buybacks continued to dominate, even as they decreased 20.3% to $54.2 billion compared to $68.0 billion for Q1 2019. Twelve-month expenditures were up 33.8% to $265.8 billion from $198.7 billion spent for the same period in 2018. The sector represents 33.0% of the index's buybacks for the quarter, flat from last quarter.
Materials buyback declined 49.3% to $2.4 billion compared to $4.8 billion for Q1 2018. Utilities declined 40.4%, to 0.9 billion from 1.5 billion in Q1 2019.
Health Care buybacks continued to be volatile, as they decreased 44.5% to $17.1 billion, down from $30.7 billion for Q1 2019, as the 12-months ending in Q2 2019, buybacks were $93.6 billion, up 6.1% from the $88.2 billion spent in the corresponding 2018 period.
Issues:
The five issues with the highest total buybacks for Q2 2019 are:
- Apple (AAPL) again led in buybacks spending $18.2 billion in Q2 2018, ranking 6th in S&P 500 history, as the level was down 23.8% from the record $23.8 billion spent in Q1 2019. Over the past 12-months, Apple has spent $71.4 billion on buybacks, almost twice the value of Ford Motor Company, up from $63.9 billion in the prior 12-month period.
- Bank of America (BAC): $6.5 billion for Q2 2019, up from $6.3 billion for Q1 2019; in the last 12-months they spent $23.0 billion, up from $17.7 billion.
- Oracle (ORCL): $6.3 billion for Q2 2019, down up from their $10.0 billion Q1 2019 expenditure; in the last 12 months they spent $36.6 billion, up from $11.9 billion.
- JP Morgan (JPM): $5.2 billion for Q2 2019, up from the $5.1 billion spent in Q1 2019; in the last 12-months they spent $20.6 billion, up from $19.2 billion.
- Cisco Systems (CSCO): $4.9 billion for Q2 2019, down from $6.1 billion for Q1 2019; in the last 12-months they spent $21.6 billion, up from $18.3 billion.
For more information about S&P Dow Jones Indices, please visit www.spdji.com.
| S&P Dow Jones Indices | | | | | | | | |
| S&P 500, $ U.S. BILLIONS (preliminary and estimates in bold) | | | | | | |||
| PERIOD | MARKET | OPERATING | AS REPORTED | | | | | DIVIDEND & |
| | VALUE | EARNINGS | EARNINGS | DIVIDENDS | BUYBACKS | DIVIDEND | BUYBACK | BUYBACK |
| | $ BILLIONS | $ BILLIONS | $ BILLIONS | $ BILLIONS | $ BILLIONS | YIELD | YIELD | YIELD |
| 12 Mo Jun,'19 Prelim. | $24,423.49 | $1,295.01 | $1,132.67 | $471.54 | $797.03 | 1.93% | 3.26% | 5.19% |
| 12 Mo Jun,'18 | $23,036.32 | $1,196.08 | $1,043.63 | $435.69 | $645.81 | 1.89% | 2.80% | 4.69% |
| 2018 | $21,026.90 | $1,281.66 | $1,119.43 | $456.31 | $806.41 | 2.17% | 3.84% | 6.01% |
| 2017 | $22,821.24 | $1,066.00 | $940.86 | $419.77 | $519.40 | 1.84% | 2.28% | 4.12% |
| 2016 | $19,267.93 | $919.85 | $818.55 | $397.21 | $536.38 | 2.06% | 2.78% | 4.85% |
| | | | | | | | | |
| 6/28/2019 Prelim | $24,423 | $335.58 | $291.25 | $118.68 | $164.48 | 1.93% | 3.26% | 5.19% |
| 3/29/2019 | $23,619 | $316.48 | $291.23 | $117.33 | $205.81 | 1.97% | 3.49% Werbung Mehr Nachrichten zur Cisco Systems Inc. Aktie kostenlos abonnieren
E-Mail-Adresse
Bitte überprüfe deine die E-Mail-Adresse.
Benachrichtigungen von ARIVA.DE (Mit der Bestellung akzeptierst du die Datenschutzhinweise) -1  Vielen Dank, dass du dich für unseren Newsletter angemeldet hast. Du erhältst in Kürze eine E-Mail mit einem Aktivierungslink. Hinweis: ARIVA.DE veröffentlicht in dieser Rubrik Analysen, Kolumnen und Nachrichten aus verschiedenen Quellen. Die ARIVA.DE AG ist nicht verantwortlich für Inhalte, die erkennbar von Dritten in den „News“-Bereich dieser Webseite eingestellt worden sind, und macht sich diese nicht zu Eigen. Diese Inhalte sind insbesondere durch eine entsprechende „von“-Kennzeichnung unterhalb der Artikelüberschrift und/oder durch den Link „Um den vollständigen Artikel zu lesen, klicken Sie bitte hier.“ erkennbar; verantwortlich für diese Inhalte ist allein der genannte Dritte. Andere Nutzer interessierten sich auch für folgende News | |


