Dienstag,
15.09.2020 16:15
von
PR Newswire
| Aufrufe: 314
S&P 500 Buybacks Decline 55.4% to $88.7 Billion; Significant Reductions Expected to continue in Q3 2020
Cloud-Computing überträgt Daten zwischen Geräten. (Symbolbild).
© PeopleImages / E+
PR Newswire
NEW YORK, Sept. 15, 2020
NEW YORK, Sept. 15, 2020 /PRNewswire/ -- S&P Dow Jones Indices ("S&P DJI") announced today that preliminary Q2 2020 S&P 500® stock buybacks, or share repurchases, were $88.7 billion – a 55.4% decrease from Q1 2020's $198.7 billion and down 46.4% from Q2 2019's $165.5 billion.
Key Takeaways:
- Companies posted a sharp decrease in buyback expenditures as the full effect of the economic impact from COVID-19 was felt. For the quarter, 49% of the S&P 500 companies did buybacks, compared to 79% in Q1 2020.
- Q2 2020 buybacks were $88.7 billion, down 55.4% from $198.7 billion in Q1 2020 and down 46.4% from $165.5 billion in Q2 2019.
- For the 12-month June 2020 period, companies spent $644.9 billion, down 19.2% from their 12-month June 2019 expenditure of $798.0 billion. The record 12-month high is $823.2 billion in March 2018.
- The cumulative rolling four quarters of repurchases continued to impact EPS, but declined, as 18.0% of the issues reduced share counts by at least 4% year-over-year, down from Q1 2019's 19.6% and 24.2% in Q2 2019; for Q3 2020 the rate is expected to decline further.
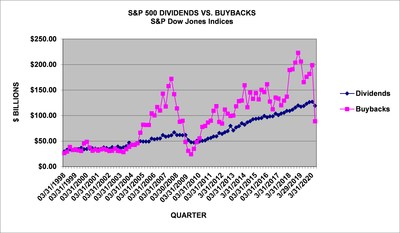
- S&P 500 Q2 2020 dividends declined 6.25% to $119.0 billion, from the Q1 2020 record $127.0 billion, and increasing 0.3% from the Q2 2019 payment of $118.7 billion. For the 12-month period, dividends set a record, at $495.5 billion, (the prior record was Q1 2020, at $495.1 billion), up 5.1% from the corresponding 2019 period's $471.5 billion.
- Total shareholder return of buybacks and dividends for the quarter came in at $207.5 billion, down 36.3% from the Q1 2020 period expenditure of $325.7 billion and down 26.9%% from the $284.1 billion reported for Q2 2019.
- Total shareholder return for the 12-month June 2020 period declined to $1.140 trillion from June 2019's $1.270 trillion.
- The top 20 issues dominated the buybacks, accounting for 87.2% of all buybacks, up from Q1 2020's 46.7% and the historical 44.5% average.
"Companies pulled back on buybacks in Q2 2020 as the COVID-19 impact on sales, liquidity, and business lines displaced share repurchases," said Howard Silverblatt, Senior Index Analyst at S&P Dow Jones Indices. "Q3 2020 expenditures are expected to be a tick better as those who have strong cash-flow and active business lines continue to buy and some recovering issues venture back-in, even if just to cover employee options and protect EPS."
"Looking beyond Q3, Q4 2020 remains contingent on the economy, which is contingent on the COVID-19 recovery," Silverblatt continued. As businesses reopen and the economy picks up, companies will need to address prior actions as well as initiate new procedures and policies to function in the new environment, including potential reorganization to address employee location needs and shifts in customer base and cycles. These expenditures could limit the discretionary buybacks they're able to do."
Q2 2020 GICS® Sector Analysis:
ARIVA.DE Börsen-Geflüster
Werbung
Weiter aufwärts?
| Kurzfristig positionieren in Alphabet A | ||
|
ME4ZR0
| Ask: 4,00 | Hebel: 19,63 |
| mit starkem Hebel |
Zum Produkt
| |
|
MB69S3
| Ask: 5,32 | Hebel: 5,85 |
| mit moderatem Hebel |
Zum Produkt
| |

Morgan Stanley
Den Basisprospekt sowie die Endgültigen Bedingungen und die Basisinformationsblätter erhalten Sie hier: ME4ZR0,MB69S3,. Beachten Sie auch die weiteren Hinweise zu dieser Werbung. Der Emittent ist berechtigt, Wertpapiere mit open end-Laufzeit zu kündigen.
Kurse
 |
 |
 |
 |
 |
 |
 |
Information Technology continued to lead in buybacks even as S&P 500 expenditures declined 55.4% from the prior quarter. The sector spent $39.6 billion for the quarter, down 37.7% from the prior quarter's $59.1 billion, and down 33.1% from the Q2 2019 $55.2 billion level. On a percentage basis, the sector increased its representation to 41.6% of all buybacks, up from the prior quarter's 29.8%. For the 12-month June 2020 period, the group spent $197.7 billion, representing 30.7% of the buybacks, down 25.9% from the corresponding 2019 period's $266.8 billion expenditure, which represented 33.4% of the buybacks.
Financial buybacks, which were slightly trailing Information Technology, declined 82.1%, to $8.3 billion from the Q1 2020 $46.6 billion expenditure, and absent Berkshire Hathaway's $ 5.0 billion expenditure was down 92.8%. Their Q2 2020 expenditure represented 9.4% of all buybacks, down from 23.5% in Q1 2019. For the one-year period, the group spent $153.0 billion, representing 23.7% of all buybacks, down 8.4% from their 2019 expenditure of $166.9 billion, which represented 20.9% of the buybacks. For Q3 2020, minimal expenditures are expected, as big-banks have suspended their buybacks for that period.
Communication Services was the only sector to increase, up 37.7% over Q1 2020, thanks to T-Mobile's $17.1 billion expenditure (in connection with the SoftBank Monetization, ranking #13 in index history); absent that, the sector was down 47.9%. For Q2 2020 the sector spent $27.5 billion, up from Q1 2020's 20.0 billion, as it represented 31.1% of the Q2 2020 buybacks.
Of sector Note: Energy declined 98.5% from Q1 2020, Consumer Discretionary fell 91.8%, and Industrials were down 91.2%.
Issues:
The five issues with the highest total buybacks for Q2 2020 are:
- Apple (AAPL) continued to lead, spending $17.6 billion in Q2 2020, ranking 11th in S&P 500 history, as the level was down 6.4% from their Q1 2020 $18.8 billion expenditure and down 3.3% from their Q2 2019 $18.2 billion. For the 12-month period, Apple has spent $76.0 billion on buybacks, up from 2019's $71.4 billion. Over the five-year period, they have spent $282.9 billion and $378.1 billion over the ten-year period.
- T-Mobile (TMUS): $17.2 billion for Q2 20120, up from $0.1 billion for Q1 2020; for the 12-months ending in June 2020 they spent $17.3 billion versus $0.2 billion.
- Alphabet (GOOG/L): $6.9 billion for Q2 20120, down from $8.5 billion for Q1 2020; for the 12-months ending in June 2020 they spent $27.1 billion versus $11.5 billion.
- Microsoft (MSFT): $5.8 billion for Q2 2020, down from $7.1 billion in Q1 2020; for the 12-months ending in June 2020 they spent $23.0 billion versus $19.5 billion.
- Regeneron Pharmaceuticals (REGN): $5.5 billion for Q2 2020, up from the $0.5 billion spent in Q1 2020; for the 12-months ending in June 2020 they spent $6.4 billion versus $0.2 billion.
For more information about S&P Dow Jones Indices, please visit www.spdji.com.
| S&P Dow Jones Indices | | | | | | | | |
| S&P 500 Q2 2020 buyback and related data | | | | | | | ||
| As of the close of: | 9/11/2020 | | | | | | | |
| | | | | | | | | |
| | | | | | | | | |
| | | | | | | | | |
| S&P Dow Jones Indices | | | | | | | | |
| S&P 500, $ U.S. BILLIONS | | (preliminary and estimates in bold) | | | | |||
| PERIOD | MARKET | OPERATING | AS REPORTED | | | | | DIVIDEND & |
| | VALUE | EARNINGS | EARNINGS | DIVIDENDS | BUYBACKS | DIVIDEND | BUYBACK | BUYBACK |
| | $ BILLIONS | $ BILLIONS | $ BILLIONS | $ BILLIONS | $ BILLIONS | YIELD | YIELD | YIELD |
| 12 Mo Jun,'20 | $25,637 | $1,037.70 | $821.66 | $495.49 | $644.85 | 1.93% | 2.52% | 4.45% |
| 12 Mo Jun,19 | $24,423 | $1,292.68 | $1,131.42 | $471.54 | $798.01 | 1.93% | 3.27% | 5.20% |
| 2019 | $26,760 | $1,304.76 | $1,158.22 | $485.48 | $728.74 | 1.81% | 2.72% | 4.54% |
| 2018 | $21,027 | $1,281.66 | $1,119.43 | $456.31 | $806.41 | 2.17% | 3.84% | 6.01% |
| 2017 | $22,821 | $1,066.00 | $940.86 | $419.77 | $519.40 | 1.84% | 2.28% | 4.12% |
| 2016 | $19,268 | $919.85 | $818.55 | $397.21 | $536.38 | 2.06% | 2.78% | 4.85% |
| | | | | | | | | |
| 6/30/2020 Prelim. Werbung Mehr Nachrichten zur Microsoft Corp. Aktie kostenlos abonnieren
E-Mail-Adresse
Bitte überprüfe deine die E-Mail-Adresse.
Benachrichtigungen von ARIVA.DE (Mit der Bestellung akzeptierst du die Datenschutzhinweise) -1  Vielen Dank, dass du dich für unseren Newsletter angemeldet hast. Du erhältst in Kürze eine E-Mail mit einem Aktivierungslink. Hinweis: ARIVA.DE veröffentlicht in dieser Rubrik Analysen, Kolumnen und Nachrichten aus verschiedenen Quellen. Die ARIVA.DE AG ist nicht verantwortlich für Inhalte, die erkennbar von Dritten in den „News“-Bereich dieser Webseite eingestellt worden sind, und macht sich diese nicht zu Eigen. Diese Inhalte sind insbesondere durch eine entsprechende „von“-Kennzeichnung unterhalb der Artikelüberschrift und/oder durch den Link „Um den vollständigen Artikel zu lesen, klicken Sie bitte hier.“ erkennbar; verantwortlich für diese Inhalte ist allein der genannte Dritte. Andere Nutzer interessierten sich auch für folgende News | ||||||||