Top-News

Donnerstag,
28.09.2017 13:30
von
PR Newswire
| Aufrufe: 98
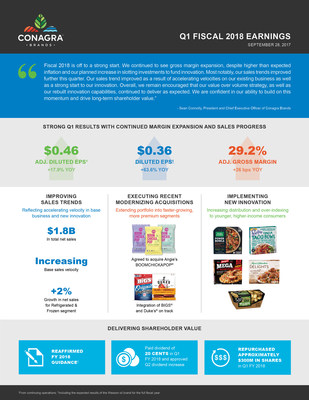
Conagra Brands Reports Strong First Quarter
Nahrungsmittelverarbeitungsmaschine mit Croissants (Symbolbild).
© genkur / iStock / Getty Images Plus / Getty Images
http://www.gettyimages.de
PR Newswire
CHICAGO, Sept. 28, 2017
CHICAGO, Sept. 28, 2017 /PRNewswire/ -- Today Conagra Brands, Inc. (NYSE: CAG) reported results for the first quarter fiscal year 2018, which ended on August 27, 2017.
Highlights
(all comparisons are against the prior year fiscal period, unless otherwise noted)
- Diluted earnings per share (EPS) from continuing operations grew 63.6% from $0.22 to $0.36; adjusted1 diluted EPS from continuing operations grew 17.9% from $0.39 to $0.46.
- The Company delivered continued sequential improvement in its net sales growth rate. Net sales decreased 4.8% and organic net sales2 decreased 3.0%. The Company estimates that incremental slotting fees associated with innovation launches negatively impacted the net sales and organic net sales growth rates by approximately 50 basis points and 42 basis points, respectively.
- Refrigerated & Frozen segment net sales grew 2% behind volume growth of 1%.
- Gross margin expanded as higher price/mix and the impact of divesting lower margin businesses offset higher than expected inflation and incremental slotting fees.
CEO Perspective
Sean Connolly, president and chief executive officer of Conagra Brands, commented, "Fiscal 2018 is off to a strong start. We continued to see gross margin expansion, despite higher than expected inflation and our planned increase in slotting investments to fund innovation. Most notably, our sales trends improved further this quarter. Our sales trend improved as a result of accelerating velocities on our existing business as well as a strong start to our innovation. Overall, we remain encouraged that our value over volume strategy, as well as our rebuilt innovation capabilities, continued to deliver as expected. We are confident in our ability to build on this momentum and drive long-term shareholder value."
Total Company Results

Net sales decreased 4.8%, and organic net sales decreased 3.0%, reflecting continued sequential improvement. Investments in slotting fees increased year-over-year, to support innovation launches in the current year quarter. This higher level of investment negatively impacted the net sales and organic net sales growth rates by approximately 50 basis points and 42 basis points, respectively.
Gross margin3 increased 3 basis points to 28.8%. Adjusted gross margin increased 26 basis points to 29.2%. Improvements in price/mix and the impact of divesting lower margin businesses more than offset the impact of input cost inflation. The Company estimates that incremental slotting fees reduced adjusted gross margin expansion by approximately 35 basis points.
Diluted EPS from continuing operations grew 63.6% from $0.22 to $0.36; adjusted diluted EPS from continuing operations grew 17.9% from $0.39 to $0.46. The growth primarily reflects lower interest expense, lower selling, general, and administrative (SG&A) expenses, increased earnings in the Ardent Mills joint venture, and the benefit of fewer shares outstanding. These benefits were partially offset by volume declines, the impact of the divestitures of the Spicetec Flavors & Seasonings and JM Swank businesses in the first quarter of fiscal 2017, and a higher effective tax rate compared to the prior year period.
Grocery & Snacks Segment Results
Net sales for the Grocery & Snacks segment decreased 2% to $746 million. The acquisitions of the Duke's, BIGS, and Frontera businesses added over 3% to the growth rate. Organic net sales decreased 5%. As planned, volume declined 6% principally from continued actions to drive improvements in trade productivity, as well as the timing of merchandising and planned discontinuations of certain lower-performing products. Price/mix increased 1% as continued progress in pricing and trade productivity more than offset the impacts of increased slotting fees to support innovation in the PAM and P.F. Chang's Home Menu businesses.
Operating profit for the segment decreased 2%, and adjusted operating profit decreased 1%. The impacts of increased slotting investments, input costs, and acquisition-related SG&A expenses more than offset favorable net pricing and a shift in timing of advertising and promotion (A&P) investments.
Refrigerated & Frozen Segment Results
Net sales for the Refrigerated & Frozen segment increased 2% to $616 million. The acquisition of the Frontera business added 1% to the growth rate. Organic net sales increased 1%, aided by base business improvements and innovation launches under the Marie Callender's and Healthy Choice trademarks. The Reddi-wip business also experienced an improved base business in the quarter. Segment volume increased 1%, primarily driven by innovation launches. Price/mix was flat compared to the prior-year period as improvements in net pricing were offset by increased slotting investments associated with innovation launches.
Operating profit for the segment increased 11% in the quarter, and adjusted operating profit increased 5%. The increases were primarily driven by increased net sales, the timing of A&P investments, reductions in SG&A expenses, and non-recurring recall expenses in the prior-year period.
International Segment Results
Net sales for the International segment decreased 2% to $191 million, and organic net sales decreased 4% as the segment executes the value over volume strategy. Volume decreased 8% from a reduction in promotional intensity and the planned discontinuation of certain lower-performing products. Price/mix increased 4% from improvements in pricing and trade productivity. Foreign exchange favorably impacted net sales by 2%.
The segment reported an operating profit of $19 million as compared to an operating loss of $149 million in the prior-year period, as the prior-year period included pre-tax goodwill and intangible impairment charges of $164 million related to the Canadian business. Adjusted operating profit increased 29% behind higher price/mix and lower A&P expenses, which were partially offset by increased input costs.
Foodservice Segment Results
Net sales for the Foodservice segment decreased 6% to $252 million as the segment executes the value over volume strategy. Volume decreased 18% and price/mix increased 12%, primarily reflecting the impact of exiting non-core and low-performing businesses.
Operating profit for the segment increased 7%. Adjusted operating profit decreased 1% as the impact of lower net sales more than offset expanding margins and reduced SG&A expenses.
Other Items
Corporate expenses increased 13% to $40 million. Adjusted corporate expenses decreased 15% to $29 million, primarily reflecting the benefits from the Company's cost savings efforts.
A&P expense decreased 15% to $55 million as the Company optimized the timing of A&P investments to support innovation through the year.
Equity method investment earnings increased $17 million to $30 million as the Ardent Mills joint venture benefitted from more favorable market conditions and continued improvement in operating efficiencies.
Net interest expense decreased 38% to $36 million, driven by significant debt reduction over the past several quarters.
Capital Allocation
In the first quarter, the Company paid a quarterly dividend of $0.20 per share. As previously announced, the Company's board of directors approved a dividend payment at the quarterly rate of $0.2125 per share to be paid on November 30, 2017 to stockholders of record as of the close of business on October 31, 2017.
In the first quarter, the Company repurchased approximately 9 million shares of its common stock for $300 million.
Portfolio Update
On September 21, 2017 (subsequent to quarter-end) the Company entered into a definitive agreement to acquire Angie's Artisan Treats, LLC, the maker of Angie's BOOMCHICKAPOP ready-to-eat popcorn, from TPG Growth for $250 million in cash, net of cash acquired and subject to a working capital adjustment. The transaction is expected to close by the end of the calendar year, subject to customary closing conditions, including the receipt of regulatory approvals.
The business is expected to generate approximately $100 million in annual net sales for the calendar year 2017.
As previously disclosed on May 30, 2017, the Company entered into a definitive agreement to sell the Wesson® oil business to The J.M. Smucker Company. The transaction is subject to certain customary closing conditions, including the termination or expiration of the waiting period under the Hart-Scott-Rodino Antitrust Improvements Act of 1976 (HSR Act).
On August 28, 2017, Smucker and the Company each received a request for additional information under the HSR Act (a second request) from the U.S. Federal Trade Commission (FTC) in connection with the FTC's review of the transaction. Issuance of the second request extends the waiting period under the HSR Act until 30 days after both the Company and Smucker have substantially complied with the request, unless the waiting period is terminated earlier by the FTC. The parties are cooperating fully with the FTC as it conducts its review of the transaction.
Fiscal 2018 Outlook
The Company is reaffirming its fiscal 2018 guidance as summarized below:
- Reported net sales growth in the range of (2)% to flat
- Organic net sales growth in the range of (2)% to flat
- Adjusted operating margin in the range of 15.9% to 16.3%
- Effective tax rate in the range of 32.5% to 33.5%
- Adjusted diluted EPS from continuing operations in the range of $1.84 to $1.89
- The Company expects to repurchase approximately $1.1 billion of shares of its common stock in the fiscal year, subject to market and other conditions
- Input cost inflation is now expected to be approximately 3.3% for the full fiscal year. The impact of inflation is expected to be weighted to the first half of the fiscal year.
The fiscal 2018 outlook includes the expected results of the Wesson oil business for the full fiscal year.
The inability to predict the amount and timing of the impacts of foreign exchange, acquisitions, and divestitures and other items impacting comparability makes a detailed reconciliation of these forward-looking non-GAAP financial measures impracticable. Please see the end of this release for more information.
Items Affecting First Quarter Fiscal 2018 Comparability
Included in the $0.36 diluted EPS from continuing operations for the first quarter of fiscal 2018 (EPS amounts rounded and after tax)
- Approximately $0.02 per diluted share of net expense, or $11.4 million pre-tax ($7.3 million after tax), related to restructuring plans ($2.3 million in cost of goods sold (COGS) and $9.1 million in SG&A)
- Approximately $0.01 per diluted share of net expense, or $6.0 million pre-tax ($3.7 million after tax), related to hedging derivative losses (all COGS)
- Approximately $0.07 per diluted share of net tax expense, or $27.8 million, related to the planned repatriation of cash from foreign subsidiaries and the tax expense related to earnings of foreign subsidiaries previously deemed to be indefinitely reinvested (all Tax)
Included in the $0.22 diluted EPS from continuing operations for the first quarter of fiscal 2017 (EPS amounts rounded and after tax)
- Approximately $0.02 per diluted share of net expense, or $14.1 million pre-tax ($9.1 million after tax), related to restructuring plans ($5.2 million in COGS and $8.9 million in SG&A)
- Approximately $0.17 per diluted share of net gain, or $198.2 million pre-tax ($75.3 million after tax), related to the gain on the sales of the Spicetec Flavors & Seasonings and JM Swank businesses (all SG&A)
- Approximately $0.34 per diluted share of net expense, or $163.6 million pre-tax ($149.5 million after tax), related to an impairment charge in the Canadian business (all SG&A)
- Approximately $0.02 per diluted share, or $7.5 million, of net gain from favorable adjustments to state tax assets related to net operating and capital losses (all Tax)
Discussion of Results
Conagra Brands will host a webcast and conference call at 9:30 a.m. Eastern Time today to discuss the results. The live audio webcast and presentation slides will be available on conagrabrands.com/investor-relations under Events & Presentations. The conference call may be accessed by dialing 1-877-883-0383 for participants in the continental U.S. and 1-412-902-6506 for all other participants and using passcode 7338896. Please dial in 10 to 15 minutes prior to the call start time. Following the Company's remarks, the conference call will include a question-and-answer session with the investment community.
A replay of the webcast will be available for one year beginning Thursday, September 28, 2017, at 12:30 p.m. ET on conagrabrands.com/investor-relations under Events & Presentations.
About Conagra Brands
Conagra Brands, Inc. (NYSE: CAG), headquartered in Chicago, is one of North America's leading branded food companies. Guided by an entrepreneurial spirit, Conagra Brands combines a rich heritage of making great food with a sharpened focus on innovation. The company's portfolio is evolving to satisfy people's changing food preferences. Conagra's iconic brands, such as Marie Callender's®, Reddi-wip®, Hunt's®, Healthy Choice®, Slim Jim® and Orville Redenbacher's®, as well as emerging brands, including Alexia®, Blake's®, Frontera® and Duke's®, offer choices for every occasion. For more information, visit www.conagrabrands.com.
Note on Forward-looking Statements
This document contains forward-looking statements within the meaning of the federal securities laws. These forward-looking statements are based on management's current expectations and are subject to uncertainty and changes in circumstances. We undertake no responsibility for updating these statements. Readers of this document should understand that these statements are not guarantees of performance or results. Many factors could affect our actual financial results and cause them to vary materially from the expectations contained in the forward-looking statements, including those set forth in this document. These risks and uncertainties include, among other things: the timing to complete the acquisition of Angie's Artisan Treats, LLC; the timing to complete the pending divestiture of certain assets related to the Wesson oil business; the ability and timing to obtain required regulatory approvals and satisfy other closing conditions for the Angie's and Wesson transactions; our ability to achieve the intended benefits of acquisitions and divestitures, including the recent spin-off of our Lamb Weston business; general economic and industry conditions; our ability to successfully execute our long-term value creation strategy; our ability to access capital; our ability to execute our operating and restructuring plans and achieve our targeted operating efficiencies from cost-saving initiatives and to benefit from trade optimization programs; the effectiveness of our hedging activities, and our ability to respond to volatility in commodities; the competitive environment and related market conditions; our ability to respond to changing consumer preferences and the success of our innovation and marketing investments; the ultimate impact of any product recalls and litigation, including litigation related to the lead paint and pigment matters; actions of governments and regulatory factors affecting our businesses; the availability and prices of raw materials, including any negative effects caused by inflation or weather conditions; risks and uncertainties associated with intangible assets, including any future goodwill or intangible assets impairment charges; the costs, disruption, and diversion of management's attention associated with campaigns commenced by activist investors; and other risks described in our reports filed from time to time with the Securities and Exchange Commission. We caution readers not to place undue reliance on any forward-looking statements included in this document, which speak only as of the date of this document.
Note on Non-GAAP Financial Measures
This document includes certain non-GAAP financial measures, including adjusted diluted EPS from continuing operations, organic net sales, adjusted operating profit for certain segments, adjusted corporate expenses, and adjusted gross margin. Management considers GAAP financial measures as well as such non-GAAP financial information in its evaluation of the Company's financial statements and believes these non-GAAP measures provide useful supplemental information to assess the Company's operating performance and financial position. These measures should be viewed in addition to, and not in lieu of, the Company's diluted earnings per share, operating performance and financial measures as calculated in accordance with GAAP.
Certain of these non-GAAP measures, such as organic net sales, adjusted operating margin, and adjusted diluted EPS from continuing operations, are forward-looking. Historically, the Company has excluded the impact of certain items impacting comparability, such as, but not limited to, restructuring expenses, the impact of the extinguishment of debt, the impact of foreign exchange, the impact of acquisitions and divestitures, hedging gains and losses, impairment charges, the impact of legacy legal contingencies, and the impact of unusual tax items, from the non-GAAP financial measures it presents. Reconciliations of these forward-looking non-GAAP financial measures to the most directly comparable GAAP financial measures are not provided because the Company is unable to provide such reconciliations without unreasonable effort, due to the uncertainty and inherent difficulty of predicting the occurrence and the financial impact of such items impacting comparability and the periods in which such items may be recognized. For the same reasons, the Company is unable to address the probable significance of the unavailable information, which could be material to future results.
Hedge gains and losses are generally aggregated, and net amounts are reclassified from unallocated corporate expense to the operating segments when the underlying commodity or foreign currency being hedged is expensed in segment cost of goods sold. The Company identifies these amounts as items that impact comparability within the discussion of unallocated Corporate results.
For more information, please contact:
MEDIA: Mike Cummins
312-549-5257
Michael.Cummins@conagra.com
INVESTORS: Brian Kearney
312-549-5002
ir@conagra.com
| Conagra Brands, Inc. Consolidated Statements of Operations (in millions) (unaudited) | |||||||||||
| | |||||||||||
| | | FIRST QUARTER | |||||||||
| | | Thirteen weeks | | Thirteen weeks | | | |||||
| | | August 27, 2017 | | August 28, 2016 | | Percent Change | |||||
| Net sales | | $ | 1,804.2 | | | $ | 1,895.6 | | | (4.8) | % |
| Costs and expenses: | | | | | | | |||||
| Cost of goods sold | | 1,285.2 | | | 1,351.0 | | | (4.9) | % | ||
| Selling, general and administrative expenses | | 239.0 | | | 231.7 | | | 3.2 | % | ||
| Interest expense, net | | 36.4 | | | 58.2 | | | (37.5) | % | ||
| Income from continuing operations before income taxes and equity method investment earnings | | 243.6 | | | 254.7 | | | (4.4) | % | ||
| | | | | | | | |||||
| Income tax expense | | 120.0 | | | 169.2 Werbung Mehr Nachrichten zur Conagra Brands Aktie kostenlos abonnieren
E-Mail-Adresse
Bitte überprüfe deine die E-Mail-Adresse.
Benachrichtigungen von ARIVA.DE (Mit der Bestellung akzeptierst du die Datenschutzhinweise) -1  Vielen Dank, dass du dich für unseren Newsletter angemeldet hast. Du erhältst in Kürze eine E-Mail mit einem Aktivierungslink. Hinweis: ARIVA.DE veröffentlicht in dieser Rubrik Analysen, Kolumnen und Nachrichten aus verschiedenen Quellen. Die ARIVA.DE AG ist nicht verantwortlich für Inhalte, die erkennbar von Dritten in den „News“-Bereich dieser Webseite eingestellt worden sind, und macht sich diese nicht zu Eigen. Diese Inhalte sind insbesondere durch eine entsprechende „von“-Kennzeichnung unterhalb der Artikelüberschrift und/oder durch den Link „Um den vollständigen Artikel zu lesen, klicken Sie bitte hier.“ erkennbar; verantwortlich für diese Inhalte ist allein der genannte Dritte. Andere Nutzer interessierten sich auch für folgende News | ||||||


