Top-News

Donnerstag,
22.03.2018 12:30
von
PR Newswire
| Aufrufe: 83
Conagra Brands Reports Net Sales And EPS Growth In Third Quarter
Die Gemüseabteilung eines Supermarktes. (Symbolfoto)
pixabay.com
PR Newswire
CHICAGO, March 22, 2018
CHICAGO, March 22, 2018 /PRNewswire/ -- Today Conagra Brands, Inc. (NYSE: CAG) reported results for the third quarter fiscal year 2018, which ended on February 25, 2018.
Highlights
(all comparisons are against the prior year fiscal period, unless otherwise noted)
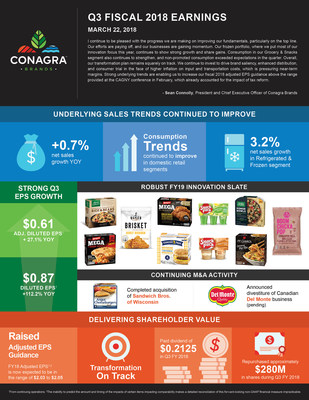
- Net sales grew 0.7% and organic net sales1 declined 2.2% in the quarter. Consumption trends continued to improve but exceeded shipments to customers in the third quarter. This follows shipments in excess of consumption in the second quarter.
- The Refrigerated & Frozen segment continued its growth momentum in the third quarter with 3.2% net sales growth.
- Elevated input cost inflation, including transportation costs, and increased investments to drive brand saliency, enhanced distribution, and consumer trial of new innovation negatively impacted gross margin.
- Aided by a lower effective tax rate, diluted earnings per share (EPS) from continuing operations grew 112.2% from $0.41 to $0.87 in the quarter, and adjusted2 diluted EPS from continuing operations grew 27.1% from $0.48 to $0.61.
- For fiscal 2018, the Company now expects adjusted EPS3 to be in the range of $2.03 to $2.05, above the previously estimated range of $1.95 to $2.02.
CEO Perspective
Sean Connolly, president and chief executive officer of Conagra Brands, commented, "I continue to be pleased with the progress we are making on improving our fundamentals, particularly on the top line. Our efforts are paying off, and our businesses are gaining momentum. Our frozen portfolio, where we put most of our innovation focus this year, continues to show strong growth and share gains. Consumption in our Grocery & Snacks segment also continues to strengthen, and non-promoted consumption exceeded expectations in the quarter."
He added, "Overall, our transformation plan remains squarely on track. We continue to invest to drive brand saliency, enhanced distribution, and consumer trial in the face of higher inflation on input and transportation costs, which is pressuring near-term margins. Strong underlying trends are enabling us to increase our fiscal 2018 adjusted EPS guidance above the range provided at the CAGNY conference in February, which already accounted for the impact of tax reform."

Total Company Results
Net sales grew 0.7%, aided by recent acquisitions. Organic net sales decreased 2.2% as improving performance in domestic retail consumption and increased price/mix were offset by reductions in retailer inventory levels. Reductions in customer inventory levels were expected in the quarter but were higher than anticipated, particularly in the Grocery & Snacks segment. Additionally, net sales were reduced by continued investments with retail customers to drive brand saliency, enhanced distribution, and consumer trial.
Gross profit decreased 3.6% to $599 million in the quarter and adjusted gross profit decreased 4.3% to $598 million. The decreases were primarily driven by increased input costs and transportation expenses, as well as investments to drive brand saliency, enhanced distribution, and consumer trial, partially offset by realized productivity savings, and increased net sales. Although gross productivity was strong in the quarter, realized productivity was suppressed by higher-than-normal operating costs that were transitory in nature. Gross margin and adjusted gross margin were 30.0% in the quarter.
Diluted EPS from continuing operations grew from $0.41 to $0.87 in the quarter; adjusted diluted EPS from continuing operations grew 27.1% to $0.61, primarily reflecting a reduction in the effective tax rate, fewer shares outstanding, and favorable SG&A and A&P compared to the prior year quarter, partially offset by lower gross profit as outlined above.
Grocery & Snacks Segment Results
Net sales for the Grocery & Snacks segment decreased 1% to $838 million in the quarter, and organic net sales declined 6%. Consumption trends continued to improve in the quarter, and non-promoted consumption exceeded expectations. Volume declined 4%, driven by retailer inventory reductions, which were higher than anticipated, and deliberate actions to optimize distribution on certain lower-margin products, consistent with the Company's value over volume strategy. Price/mix declined 2% as the Company increased its investments with retail customers to drive brand saliency, enhanced distribution, and consumer trial. The acquisitions of the Duke's, BIGS, and Angie's BOOMCHICKAPOP businesses added approximately 500 basis points to the net sales growth rate.
Operating profit for the segment decreased 13%, and adjusted operating profit decreased 16%. The decreases were driven by higher input costs and transportation expenses, the previously-mentioned volume declines, and lower than expected supply chain realized productivity. Although gross productivity was strong in the quarter, realized productivity was suppressed by higher-than-normal operating costs that were transitory in nature. Additionally, the recent growth-focused acquisitions aided the segment's operating profit growth rate but reduced the operating margin percentage as these businesses maintained strong A&P investments as well as elevated SG&A levels as they integrate into the Company.
Refrigerated & Frozen Segment Results
Net sales for the Refrigerated & Frozen segment increased 3% to $689 million in the quarter. Organic net sales grew 3% behind volume growth of 2% driven by core business improvements and innovation launches in the Marie Callender's, Healthy Choice, and Banquet businesses. Price/mix increased 1% as mix improvements from recent innovation more than offset investments with retail customers to drive brand saliency, enhanced distribution, and consumer trial.
Operating profit for the segment decreased 2% in the quarter. Adjusted operating profit decreased 1% as the benefits of net sales growth and supply chain realized productivity savings were more than offset by increased input costs and transportation expenses.
International Segment Results
Net sales for the International segment increased 9% to $223 million in the quarter, and organic net sales grew 4% as foreign exchange favorably impacted the net sales growth rate by approximately 500 basis points. Volume increased 1% and price/mix increased 3%, reflecting the impacts of the ongoing value over volume strategy.
Operating profit for the segment increased 63%, and adjusted operating profit increased 67% in the quarter behind improved price/mix, timing and optimization of A&P spending, and the favorable impact of foreign exchange.
Foodservice Segment Results
Net sales for the Foodservice segment decreased 6% to $244 million in the quarter. Volume decreased 13% behind planned discontinuations of certain lower-performing businesses and softness in certain categories. Price/mix increased 7% driven by improved product mix as well as pricing to cover inflation.
Operating profit decreased 13% in the quarter primarily as the benefits of favorable price/mix and supply chain realized productivity were more than offset by the previously-mentioned decrease in volume as well as increased input costs.
Other Items
Corporate expenses decreased 18% to $87 million in the quarter. Adjusted corporate expenses decreased 27% to $38 million, primarily driven by timing of incentive compensation accruals in the year ago quarter and planned reductions in project spending. This favorability was partially offset by reduced transition service agreement income.
A&P expense decreased 14% to $78 million in the quarter as the Company continued to shift investments to drive brand saliency, enhanced distribution, and consumer trial.
Equity method investment earnings increased 33% to $29 million. Adjusted equity method investment earnings increased 14% to $25 million as the Ardent Mills joint venture benefitted from continued improvements in operating efficiencies and favorable market conditions.
Net interest expense decreased 13% to $40 million in the quarter, driven by effective debt management.
On December 22, 2017, the 2017 U.S. Tax Cuts and Jobs Act (the "Tax Act") was signed into law. The Tax Act reduces the corporate federal statutory tax rate from a maximum of 35% to a flat 21%, and modifies certain policies, credits and deductions applicable to the Company. It also has certain international tax consequences. The Tax Act's corporate rate reduction became effective January 1, 2018, in the middle of the Company's third quarter. Given the Company's off calendar fiscal year end, our fiscal 2018 federal statutory tax rate will be a blended rate. The Company's federal statutory rate will reduce to 21% in fiscal 2019. Among items recorded during the third quarter as a result of the Tax Act are the revaluation of the Company's deferred tax assets and liabilities to account for the future impact of lower corporate tax rates and the transition tax related to the change to a territorial foreign tax regime. These changes resulted in a one-time estimated income tax benefit of $236.7 million in the quarter. This amount may be adjusted in the future as further information and interpretations of the Tax Act become available.
Capital Allocation
In the quarter, the Company paid a quarterly dividend of $0.2125 per share.
In the quarter, the Company repurchased approximately 8 million shares of its common stock for $280 million.
As previously disclosed, on February 26, 2018, the Company borrowed $300 million pursuant to a term loan agreement entered into on February 22, 2018. The term loan bears interest at a rate equal to three-month LIBOR plus 0.75% per annum or an alternate base rate described in the term loan agreement. The Company used the proceeds from this borrowing to make a voluntary pension plan contribution in the amount of $300 million.
Portfolio Update
As previously disclosed, on February 5, 2018, the Company completed the acquisition of the Sandwich Bros. of Wisconsin business.
As previously disclosed, on February 20, 2018, the Company announced it entered into a definitive agreement to sell its Del Monte processed fruit and vegetable business in Canada to Bonduelle Group. The sale is subject to customary closing conditions, including regulatory approvals, and is expected to be completed by the end of fiscal 2018. The transaction is valued at approximately CA$43 million, which was approximately US$34 million at the exchange rate on the date of announcement.
As previously disclosed, on March 6, 2018, Conagra Brands and The J.M. Smucker Company terminated the agreement for the sale of Conagra's Wesson oil business to The J.M. Smucker Company. This outcome follows the decision of the Federal Trade Commission, announced on March 5, 2018, to challenge the pending transaction. The Company intends to continue its evaluation of the role of the Wesson oil business within its portfolio.
Fiscal 2018 Outlook
The Company is updating its fiscal 2018 guidance as summarized below:
Items being reiterated
- Organic net sales growth near the high end of the range of (2)% to flat.
- Adjusted operating margin near the low end of the range of 15.9% to 16.3%.
- Effective tax rate of in the range of 29% to 30%.
- The repurchase of approximately $1.1 billion of shares of its common stock in the fiscal year, subject to market and other conditions.
- Input cost inflation of approximately 3.7% for the full fiscal year.
Items being updated
- Reported net sales growth approximately 150 basis points higher than the organic net sales growth rate due to the impacts of acquisitions and foreign exchange.
- Adjusted diluted EPS from continuing operations in the range of $2.03 to $2.05.
The inability to predict the amount and timing of the impacts of foreign exchange, acquisitions, divestitures, and other items impacting comparability makes a detailed reconciliation of these forward-looking non-GAAP financial measures impracticable. Please see the end of this release for more information.
Items Affecting Third Quarter Fiscal 2018 Comparability
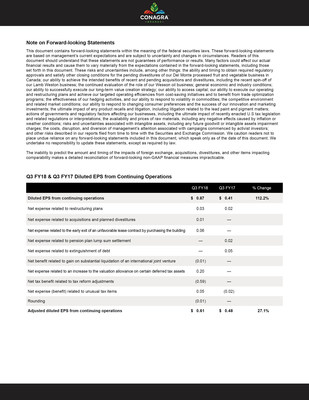
Included in the $0.87 diluted EPS from continuing operations for the third quarter of fiscal 2018 (EPS amounts rounded and after tax)
- Approximately $0.03 per diluted share of net expense, or $14.7 million pre-tax ($10.8 million after tax), related to restructuring plans ($0.1 million benefit in cost of goods sold (COGS) and $14.8 million expense in SG&A)
- Approximately $0.01 per diluted share of net expense, or $3.1 million pre-tax ($2.1 million after tax), related to costs associated with acquisitions and planned divestitures ($0.6 million in COGS and $2.5 million in SG&A)
- Approximately $0.06 of per diluted share of net expense, or $34.9 million pre-tax ($25.6 million after tax), related to the early exit of an unfavorable lease contract by purchasing the building (SG&A)
- Approximately $0.01 per diluted share of net benefit, or $4.3 million pre-tax ($2.9 million after tax), related to the substantial liquidation of an international joint venture (Equity method investment earnings)
- Approximately $0.20 per diluted share of net tax expense, or $78.6 million, associated with the termination of the sales agreement for the Wesson oil business which resulted in an increase to the valuation allowance on certain deferred tax assets (Tax)
- Approximately $0.59 per diluted share of net tax benefit, or $236.7 million, for the initial estimated one-time impact of the Tax Act (Tax)
- Approximately $0.05 per diluted share of net tax expense, or $19.4 million, for unusual tax items, including the indirect tax effect of the recent pension contribution and the effect of a law change in Mexico requiring deconsolidation for tax reporting purposes (Tax)
Included in the $0.41 diluted EPS from continuing operations for the third quarter of fiscal 2017 (EPS amounts rounded and after tax)
- Approximately $0.02 per diluted share of net expense, or $13.7 million pre-tax ($8.9 million after tax), related to restructuring plans ($4.7 million in COGS and $9.0 million in SG&A)
- Approximately $0.02 per diluted share of net expense, or $13.8 million pre-tax ($8.5 million after tax), related to a pension plan lump sum settlement (SG&A)
- Approximately $0.05 per diluted share of net expense, or $32.7 million pre-tax ($21.1 million after tax), related to extinguishment of debt (SG&A)
- Approximately $0.02 per diluted share of net tax benefit, or $7.1 million, primarily related to the receipt of foreign tax incentives (Tax)
Discussion of Results
Conagra Brands will host a webcast and conference call at 9:30 a.m. Eastern Time today to discuss the results. The live audio webcast and presentation slides will be available on www.conagrabrands.com/investor-relations under Events & Presentations. The conference call may be accessed by dialing 1-877-883-0383 for participants in the continental U.S. and 1-412-902-6506 for all other participants and using passcode 3125366. Please dial in 10 to 15 minutes prior to the call start time. Following the Company's remarks, the conference call will include a question-and-answer session with the investment community.
A replay of the webcast will be available on conagrabrands.com/investor-relations under Events & Presentations until March 22, 2019.
About Conagra Brands
Conagra Brands, Inc. (NYSE: CAG), headquartered in Chicago, is one of North America's leading branded food companies. Guided by an entrepreneurial spirit, Conagra Brands combines a rich heritage of making great food with a sharpened focus on innovation. The company's portfolio is evolving to satisfy people's changing food preferences. Conagra's iconic brands, such as Marie Callender's®, Reddi-wip®, Hunt's®, Healthy Choice®, Slim Jim® and Orville Redenbacher's®, as well as emerging brands, including Alexia®, Blake's®, Frontera®, Duke's® and Angie's® BOOMCHICKAPOP®, offer choices for every occasion. For more information, visit www.conagrabrands.com.
Note on Forward-looking Statements
This document contains forward-looking statements within the meaning of the federal securities laws. These forward-looking statements are based on management's current expectations and are subject to uncertainty and changes in circumstances. Readers of this document should understand that these statements are not guarantees of performance or results. Many factors could affect our actual financial results and cause them to vary materially from the expectations contained in the forward-looking statements, including those set forth in this document. These risks and uncertainties include, among other things: the ability and timing to obtain required regulatory approvals and satisfy other closing conditions for the pending divestitures of our Del Monte processed fruit and vegetable business in Canada; our ability to achieve the intended benefits of recent and pending acquisitions and divestitures, including the recent spin-off of our Lamb Weston business; the continued evaluation of the role of our Wesson oil business; general economic and industry conditions; our ability to successfully execute our long-term value creation strategy; our ability to access capital; our ability to execute our operating and restructuring plans and achieve our targeted operating efficiencies from cost-saving initiatives and to benefit from trade optimization programs; the effectiveness of our hedging activities, and our ability to respond to volatility in commodities; the competitive environment and related market conditions; our ability to respond to changing consumer preferences and the success of our innovation and marketing investments; the ultimate impact of any product recalls and litigation, including litigation related to the lead paint and pigment matters; actions of governments and regulatory factors affecting our businesses, including the ultimate impact of recently enacted U.S tax legislation and related regulations or interpretations; the availability and prices of raw materials, including any negative effects caused by inflation or weather conditions; risks and uncertainties associated with intangible assets, including any future goodwill or intangible assets impairment charges; the costs, disruption, and diversion of management's attention associated with campaigns commenced by activist investors; and other risks described in our reports filed from time to time with the Securities and Exchange Commission. We caution readers not to place undue reliance on any forward-looking statements included in this document, which speak only as of the date of this document. We undertake no responsibility to update these statements, except as required by law.
Note on Non-GAAP Financial Measures
This document includes certain non-GAAP financial measures, including adjusted diluted EPS from continuing operations, organic net sales, adjusted gross profit, adjusted operating profit, adjusted corporate expenses, adjusted SG&A, adjusted gross margin, adjusted operating margin, and adjusted equity method investment earnings. Management considers GAAP financial measures as well as such non-GAAP financial information in its evaluation of the Company's financial statements and believes these non-GAAP measures provide useful supplemental information to assess the Company's operating performance and financial position. These measures should be viewed in addition to, and not in lieu of, the Company's diluted earnings per share, operating performance and financial measures as calculated in accordance with GAAP.
Certain of these non-GAAP measures, such as organic net sales, adjusted operating margin, and adjusted diluted EPS from continuing operations, are forward-looking. Historically, the Company has excluded the impact of certain items impacting comparability, such as, but not limited to, restructuring expenses, the impact of the extinguishment of debt, the impact of foreign exchange, the impact of acquisitions and divestitures, hedging gains and losses, impairment charges, the impact of legacy legal contingencies, and the impact of unusual tax items, from the non-GAAP financial measures it presents. Reconciliations of these forward-looking non-GAAP financial measures to the most directly comparable GAAP financial measures are not provided because the Company is unable to provide such reconciliations without unreasonable effort, due to the uncertainty and inherent difficulty of predicting the occurrence and the financial impact of such items impacting comparability and the periods in which such items may be recognized. For the same reasons, the Company is unable to address the probable significance of the unavailable information, which could be material to future results.
Hedge gains and losses are generally aggregated, and net amounts are reclassified from unallocated corporate expense to the operating segments when the underlying commodity or foreign currency being hedged is expensed in segment cost of goods sold. The Company identifies these amounts as items that impact comparability within the discussion of unallocated Corporate results.
For more information, please contact:
MEDIA: Mike Cummins
312-549-5257
Michael.Cummins@conagra.com
INVESTORS: Brian Kearney
312-549-5002
ir@conagra.com
| Conagra Brands, Inc. Consolidated Statements of Operations (in millions) (unaudited) | |||||||||||
| | |||||||||||
| | | THIRD QUARTER | |||||||||
| | | Thirteen weeks | | Thirteen weeks | | | |||||
| | | February 25, 2018 | | February 26, 2017 | | Percent Change | |||||
| Net sales | | $ | 1,994.5 | | | $ | 1,981.2 | | | 0.7 | % |
| Costs and expenses: | | | | | | | |||||
| Cost of goods sold | | 1,395.7 | | | 1,360.2 | | | 2.6 | % | ||
| Selling, general and administrative expenses | | 330.2 | | | 349.7 | | | (5.6) | % | ||
| Interest expense, net | | 39.8 | | | 45.7 | | | (12.7) | % | ||
| Income from continuing operations before income taxes and equity method investment earnings | | 228.8 | | | 225.6 | | | 1.4 | % | ||
| | | | | | | | |||||
| Income tax expense (benefit) | | (91.4) | | | 67.9 | | | N/A | | ||
| Equity method investment earnings | | 29.0 | | | 21.8 | | | 33.1 | % | ||
| Income from continuing operations | | 349.2 | | | 179.5 | | | 94.6 | % | ||
| Income from discontinued operations, net of tax Werbung Mehr Nachrichten zur Conagra Brands Aktie kostenlos abonnieren
E-Mail-Adresse
Bitte überprüfe deine die E-Mail-Adresse.
Benachrichtigungen von ARIVA.DE (Mit der Bestellung akzeptierst du die Datenschutzhinweise) -1  Vielen Dank, dass du dich für unseren Newsletter angemeldet hast. Du erhältst in Kürze eine E-Mail mit einem Aktivierungslink. Hinweis: ARIVA.DE veröffentlicht in dieser Rubrik Analysen, Kolumnen und Nachrichten aus verschiedenen Quellen. Die ARIVA.DE AG ist nicht verantwortlich für Inhalte, die erkennbar von Dritten in den „News“-Bereich dieser Webseite eingestellt worden sind, und macht sich diese nicht zu Eigen. Diese Inhalte sind insbesondere durch eine entsprechende „von“-Kennzeichnung unterhalb der Artikelüberschrift und/oder durch den Link „Um den vollständigen Artikel zu lesen, klicken Sie bitte hier.“ erkennbar; verantwortlich für diese Inhalte ist allein der genannte Dritte. Andere Nutzer interessierten sich auch für folgende News | |||||||||||