Top-News

Donnerstag,
08.02.2018 23:00
von
PR Newswire
| Aufrufe: 58
BSB Bancorp, Inc. Reports 2017 Results - Year Over Year Earnings Growth of 20%
Ein Arzt berät einen Patienten (Symbolbild).
© TommL / Vetta / Getty Images
https://www.gettyimages.de/
PR Newswire
BELMONT, Mass., Feb. 8, 2018
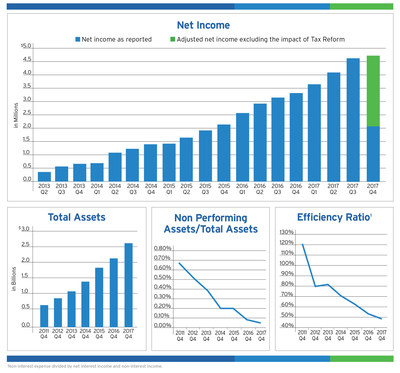
BELMONT, Mass., Feb. 8, 2018 /PRNewswire/ -- BSB Bancorp, Inc. (NASDAQ-BLMT) (the "Company"), the holding company for Belmont Savings Bank (the "Bank"), a state-chartered savings bank headquartered in Belmont, Massachusetts, today reported net income of $2.11 million or $0.23 per diluted share for the quarter ended December 31, 2017 compared to net income of $3.31 million or $0.37 per diluted share for the quarter ended December 31, 2016 representing a decrease of 36.3% in net income. The fourth quarter of 2017 included a one-time charge of $2.63 million, recorded within income tax expense, related to the enactment of the Tax Cuts and Jobs Act ("Tax Reform Act"). This charge resulted from the re-measurement of the Bank's deferred tax assets due to a lower future U.S corporate income tax rate. Excluding the impact of the Tax Reform Act, adjusted net income was $4.73 million or $0.51 per adjusted diluted share for the quarter ended December 31, 2017 representing an increase in adjusted net income of 43.0% compared to the fourth quarter of 2016. Excluding the impact of the Tax Reform Act, the Bank has had 18 consecutive quarters of earnings growth. For the year ended December 31, 2017, the Company reported net income of $14.39 million or $1.55 per diluted share as compared to net income of $11.98 million or $1.33 per diluted share for the year ended December 31, 2016 or an increase in net income of 20.1%. Excluding the impact of the Tax Reform Act, adjusted net income was $17.01 million or $1.84 per adjusted diluted share for the year ended December 31, 2017 representing an increase in adjusted net income of 42.0% compared to 2016. The Tax Reform Act is expected to benefit future earnings as the statutory federal income tax rate is lower beginning in 2018. Adjusted net income and adjusted earnings per share figures are non-GAAP financial measures that exclude the impact of the Tax Reform Act from net income and earnings per share. Refer to Appendix A for a reconciliation of these measures to reported results.
Robert M. Mahoney, President and Chief Executive Officer, said, "We completed another successful quarter and year. We continue to enjoy good loan and deposit growth while managing expenses closely. Our disciplined underwriting of loans has resulted in modest credit costs. We are well positioned to take advantage of the business opportunities that our strong local economy affords us."
NET INTEREST AND DIVIDEND INCOME
Net interest and dividend income before provision for loan losses for the quarter ended December 31, 2017 was $14.70 million as compared to $12.37 million for the quarter ended December 31, 2016 or an 18.8% increase. The provision for loan losses for the quarter ended December 31, 2017 was $691,000 as compared to $601,000 for the quarter ended December 31, 2016 or a 15.0% increase. The combination of these items resulted in an increase of $2.24 million or 19.0% in net interest and dividend income after provision for loan losses for the quarter ended December 31, 2017 as compared to the quarter ended December 31, 2016. Net interest and dividend income before provision for loan losses for the year ended December 31, 2017 was $56.09 million as compared to $47.39 million for the year ended December 31, 2016 or an 18.4% increase. The provision for loan losses for the year ended December 31, 2017 was $2.76 million as compared to $2.39 million for the year ended December 31, 2016 or a 15.8% increase. The combination of these items resulted in an increase of $8.32 million or 18.5% in net interest and dividend income after provision for loan losses for the year ended December 31, 2017 as compared to the year ended December 31, 2016.
NONINTEREST INCOME
Noninterest income for the quarter ended December 31, 2017 was $1.12 million as compared to $703,000 for the quarter ended December 31, 2016 or an increase of 58.9%.

- Net gains on sales of securities increased $38,000 from zero as we sold one security classified as available for sale.
- Net gains on sales of loans increased $242,000 or 302.5% due to an increase in the number of loans sold.
- Other income increased by $134,000 or 496.3% primarily due to vendor loss experience refunds and increases in the values of investments held in a Rabbi Trust.
Noninterest income for the year ended December 31, 2017 was $3.63 million as compared to $2.75 million for the year ended December 31, 2016 or an increase of 31.9%.
- Customer service fees decreased $118,000 or 13.1% primarily due to declines in NSF and other fees.
- Income from bank-owned life insurance increased $70,000 or 6.7% primarily due to a purchase of $5.00 million in additional bank-owned life insurance policies at the end of the second quarter of 2016.
- Net gains on sales of securities increased $38,000 from zero as we sold one security classified as available for sale.
- Net gains on sales of loans increased $665,000 or 245.4% due to an increase in the number of loans sold.
- Loan servicing fee income increased $48,000 or 13.7% due to an improvement in the value of our mortgage servicing right asset.
- Other income increased by $174,000 or 98.9% primarily due to vendor loss experience refunds and increases in the values of investments held in a Rabbi Trust.
NONINTEREST EXPENSE
Noninterest expense for the quarter ended December 31, 2017 was $7.64 million as compared to $7.05 million for the quarter ended December 31, 2016 or an increase of 8.4%.
- Salaries and employee benefits increased $441,000 or 10.0% driven by stock-based compensation related to grants of restricted stock made during the first quarter of 2017, an increase in the number of employees, an increase in health care costs and an increase in supplemental executive retirement plan costs tied to a reduction in the discount rate.
- Director compensation increased $150,000 or 81.1% primarily driven by stock-based compensation related to grants of restricted stock made during the first quarter of 2017, increased deferred compensation costs related to the increase in value of the investments held in the Rabbi Trust and increases in supplemental retirement plan costs tied to a reduction in the discount rate.
- Deposit insurance expense increased by $87,000 or 22.0% primarily driven by asset growth.
- Marketing costs decreased by $51,000, or 22.8% primarily due to a higher proportion of our marketing budget being utilized in the first half of 2017.
Noninterest expense for the year ended December 31, 2017 was $30.69 million as compared to $28.35 million for the year ended December 31, 2016 or an increase of 8.2%.
- Salaries and employee benefits increased $1.77 million or 9.9% driven by stock-based compensation related to grants of restricted stock made during the first quarter of 2017, an increase in the number of employees, an increase in cash-based incentive compensation and an increase in health care costs.
- Director compensation increased $384,000 or 39.5% primarily driven by stock-based compensation related to grants of restricted stock made during the first quarter of 2017 and increased deferred compensation costs related to the increase in value of the investments held in the Rabbi Trust.
- Deposit insurance expense increased by $448,000 or 34.9% primarily driven by asset growth.
- Data processing fees decreased by $327,000 or 10.5% as we renegotiated certain contracts with service providers in late 2016.
Our efficiency ratio improved to 48.3% for the quarter ended December 31, 2017 from 53.9% for the quarter ended December 31, 2016 and to 51.4% for the year ended December 31, 2017 from 56.5% for the year ended December 31, 2016 as we continue to grow the balance sheet and manage costs. A talented and committed colleague team along with continued operational enhancements have contributed to the improvement in our efficiency ratio.
INCOME TAXES
We recorded a provision for income taxes of $5.38 million for the quarter ended December 31, 2017, compared to a provision for income taxes of $2.12 million for the quarter ended December 31, 2016, reflecting effective tax rates of 71.9% and 39.0%, respectively. We recorded a provision for income taxes of $11.88 million for the year ended December 31, 2017, compared to a provision for income taxes of $7.43 million for the year ended December 31, 2016, reflecting effective tax rates of 45.2% and 38.3%, respectively. As noted above, the fourth quarter of 2017 included a one-time charge of $2.63 million recorded within income tax expense related to the re-measurement of the Bank's deferred tax assets due to a lower future U.S corporate income tax rate. This charge resulted from the re-measurement of the Bank's deferred tax assets due to a lower U.S corporate income tax rate.
BALANCE SHEET
At December 31, 2017, total assets were $2.68 billion, an increase of $517.86 million or 24.0% from $2.16 billion at December 31, 2016. The Company experienced net loan growth of $430.92 million or 23.1% from December 31, 2016 to December 31, 2017. One-to-four family residential real estate loans and commercial real estate loans increased by $335.72 million and $150.23 million, respectively. Partially offsetting these increases were a decrease in construction loans of $35.96 million and a decrease in indirect auto loans of $30.01 million. The decrease in indirect auto loans was driven by the suspension of new originations due to current market conditions. The asset growth was primarily funded by growth in deposits and Federal Home Loan Bank advances.
At December 31, 2017, deposits totaled $1.75 billion, an increase of $281.83 million or 19.2% from $1.47 billion at December 31, 2016. Core deposits, which we consider to include all deposits other than CDs, increased by $112.72 million or 9.9% from $1.13 billion at December 31, 2016 to $1.25 billion at December 31, 2017. Hal R. Tovin, Executive Vice President and Chief Operating Officer, said "2017 was a very strong year for deposit growth at Belmont Savings. Expansion of our Business Banking team, diligent focus on key target segments, continued success with commercial relationship expansion and consistent retail deposit product development and marketing were key factors in driving this performance."
Total stockholders' equity increased by $17.11 million or 10.6% from $160.92 million as of December 31, 2016 to $178.03 million as of December 31, 2017. This increase is primarily the result of earnings of $14.39 million and a $2.58 million increase in additional paid-in capital related to stock-based compensation.
ASSET QUALITY
Asset quality remains strong. The allowance for loan losses in total and as a percentage of total loans as of December 31, 2017 was $16.31 million and 0.71%, respectively, as compared to $13.59 million and 0.73%, respectively, as of December 31, 2016. For the year ended December 31, 2017, the Company recorded net charge offs of $35,000, as compared to net charge offs of $40,000 for the year ended December 31, 2016. Total non-performing assets were $1.38 million or 0.05% of total assets as of December 31, 2017 as compared to $1.82 million or 0.08% of total assets as of December 31, 2016.
Company Profile
BSB Bancorp, Inc. is headquartered in Belmont, Massachusetts and is the holding company for Belmont Savings Bank. The Bank provides financial services to individuals, families, municipalities and businesses through its six full-service branch offices located in Belmont, Watertown, Cambridge, Newton and Waltham in Southeast Middlesex County, Massachusetts. The Bank's primary lending market includes Essex, Middlesex, Norfolk and Suffolk Counties, Massachusetts. The Company's common stock is traded on the NASDAQ Capital Market under the symbol "BLMT." For more information, visit the Company's website at www.belmontsavings.com.
Forward-looking statements
Certain statements herein constitute "forward-looking statements" within the meaning of Section 27A of the Securities Act of 1933 and Section 21E of the Securities Exchange Act of 1934, as amended. These statements are based on the beliefs and expectations of management, as well as the assumptions made using information currently available to management. Since these statements reflect the views of management concerning future events, these statements involve risks, uncertainties and assumptions. As a result, actual results may differ from those contemplated by these statements. Forward-looking statements can be identified by the fact that they do not relate strictly to historical or current facts. They often include words like "believe," "expect," "anticipate," "estimate," and "intend" or future or conditional verbs such as "will," "would," "should," "could" or "may." Certain factors that could cause actual results to differ materially from expected results include changes in the interest rate environment, changes in general economic conditions, the Company's ability to continue to increase loans and deposit growth, legislative and regulatory changes that adversely affect the businesses in which the Company is engaged, changes in the securities market, and other factors that are described in the Company's annual report on Form 10-K and quarterly reports on Form 10-Q as filed with the Securities and Exchange Commission. Readers are cautioned not to place undue reliance on these forward-looking statements, which speak only as of the date of this release. The Company disclaims any intent or obligation to update any forward-looking statements, whether in response to new information, future events or otherwise, except as may be required by law.
| BSB BANCORP, INC. AND SUBSIDIARIES | ||||||||
| CONSOLIDATED BALANCE SHEETS | ||||||||
| (Dollars in thousands, except share and per share data) | ||||||||
| | | | | | | | | |
| | | | | | December 31, 2017 | | December 31, 2016 | |
| | | | | | (unaudited) | | | |
| ASSETS | | | | | | |||
| Cash and due from banks | | $ 1,771 | | $ 2,211 | | |||
| Interest-bearing deposits in other banks | | 109,117 | | 56,665 | | |||
| | | | Cash and cash equivalents | | 110,888 | | 58,876 | |
| Interest-bearing time deposits with other banks | | 2,440 | | 234 | | |||
| Investments in available-for-sale securities | | 16,921 | | 22,048 | | |||
| Investments in held-to-maturity securities (fair value of $158,385 as of | | | | | | |||
| | | December 31, 2017 and $129,465 as of December 31, 2016) | | 160,090 | | 130,197 | | |
| Federal Home Loan Bank stock, at cost | | 32,382 | | 25,071 | | |||
| Loans, net of allowance for loan losses of $16,312 as of | | | | | | |||
| | | December 31, 2017 and $13,585 as of December 31, 2016 | | 2,296,958 | | 1,866,035 | | |
| Premises and equipment, net | | 2,254 | | 2,355 | | |||
| Accrued interest receivable | | 6,344 | | 4,635 | | |||
| Deferred tax asset, net | | 5,794 | | 8,321 | | |||
| Income taxes receivable | | 53 | | 423 | | |||
| Bank-owned life insurance | | 36,967 | | 35,842 | | |||
| Other assets | | 5,474 | | 4,667 | | |||
| | | | Total assets | | $ 2,676,565 | | $ 2,158,704 | |
| | | | | | | | | |
| LIABILITIES AND STOCKHOLDERS' EQUITY | | | | | | |||
| Deposits: | | | | | | |||
| | | Noninterest-bearing | | $ 221,462 | | $ 208,082 | | |
| | | Interest-bearing | | 1,529,789 | | 1,261,340 | | |
| | | | Total deposits | | 1,751,251 | | 1,469,422 | |
| Federal Home Loan Bank advances | | 723,150 | | 508,850 | | |||
| Securities sold under agreements to repurchase | | 3,268 | | 1,985 Werbung Mehr Nachrichten zur BSB BANCORP Aktie kostenlos abonnieren
E-Mail-Adresse
Bitte überprüfe deine die E-Mail-Adresse.
Benachrichtigungen von ARIVA.DE (Mit der Bestellung akzeptierst du die Datenschutzhinweise) -1  Vielen Dank, dass du dich für unseren Newsletter angemeldet hast. Du erhältst in Kürze eine E-Mail mit einem Aktivierungslink. Hinweis: ARIVA.DE veröffentlicht in dieser Rubrik Analysen, Kolumnen und Nachrichten aus verschiedenen Quellen. Die ARIVA.DE AG ist nicht verantwortlich für Inhalte, die erkennbar von Dritten in den „News“-Bereich dieser Webseite eingestellt worden sind, und macht sich diese nicht zu Eigen. Diese Inhalte sind insbesondere durch eine entsprechende „von“-Kennzeichnung unterhalb der Artikelüberschrift und/oder durch den Link „Um den vollständigen Artikel zu lesen, klicken Sie bitte hier.“ erkennbar; verantwortlich für diese Inhalte ist allein der genannte Dritte. Andere Nutzer interessierten sich auch für folgende News | ||||