Top-News

Montag,
31.07.2017 22:10
von
PR Newswire
| Aufrufe: 41
Brixmor Property Group Reports Second Quarter 2017 Results
Eine Tageszeitung (Symbolbild).
pixabay.com
PR Newswire
NEW YORK, July 31, 2017
NEW YORK, July 31, 2017 /PRNewswire/ -- Brixmor Property Group Inc. (NYSE: BRX) ("Brixmor" or the "Company") announced today its operating results for the three and six months ended June 30, 2017. For the three months ended June 30, 2017, net income attributable to common stockholders was $0.25 per diluted share compared with $0.21 per diluted share in the comparable 2016 period.
Key highlights for the three months ended June 30, 2017 include:
- Executed 2.9 million square feet of total leasing volume, including options, at comparable rent spreads of 13.7%
- Executed 1.9 million square feet of new and renewal leases at comparable rent spreads of 16.8%, including 0.8 million square feet of new leases at comparable rent spreads of 36.1%
- Achieved new and renewal lease ABR PSF of $16.65, highest since IPO
- Increased small shop leased occupancy by 80 basis points year-over-year to 85.0%; Overall leased occupancy declined to 92.0%, driven primarily by recent tenant bankruptcies
- Generated same property NOI growth of 1.3%, with same property base rent growth of 2.5%
- Grew FFO per diluted share 3.6% year-over-year, excluding non-cash GAAP rental adjustments and lease termination fees
- Completed $75.5 million of dispositions, with an additional $20.8 million completed subsequent to June 30, 2017
- Issued $500.0 million of 3.650% Senior Notes due 2024 and entered into a $300.0 million seven-year unsecured term loan
"Our enhanced platform continued to drive market leading leasing productivity and rollover growth as we capitalize on retailer disruption to improve the tenancy and merchandising of our well located shopping centers, with retailers new to our portfolio such as Lucky's Market, HomeSense and BevMo!," commented James Taylor, Chief Executive Officer and President. "We also accelerated our pace of dispositions to capitalize on favorable private market valuations. Finally, we continued to strengthen our balance sheet by reducing leverage, increasing unencumbered NOI to 80% and extending our weighted average maturity."
FINANCIAL HIGHLIGHTS
Net Income
- For the three months ended June 30, 2017 and 2016, net income attributable to common stockholders was $75.4 million, or $0.25 per diluted share, and $64.5 million, or $0.21 per diluted share, respectively.
- For the six months ended June 30, 2017 and 2016, net income attributable to common stockholders was $147.0 million, or $0.48 per diluted share, and $124.9 million, or $0.42 per diluted share, respectively.
NAREIT FFO
- For the three months ended June 30, 2017 and 2016, NAREIT FFO was $161.9 million, or $0.53 per diluted share, and $152.7 million, or $0.50 per diluted share, respectively. Results for the three months ended June 30, 2017 include litigation and other non-routine legal expenses and other items that impact FFO comparability of ($1.5) million, or ($0.00) per diluted share. Results for the three months ended June 30, 2016 include executive equity based compensation, executive severance expenses and other items that impact FFO comparability of ($6.0) million, or ($0.02) per diluted share.
- For the six months ended June 30, 2017 and 2016, NAREIT FFO was $323.4 million, or $1.06 per diluted share, and $314.0 million, or $1.03 per diluted share, respectively. Results for the six months ended June 30, 2017 include litigation and other non-routine legal expenses and a loss on extinguishment of debt of ($3.0) million, or ($0.01) per diluted share. Results for the six months ended June 30, 2016 include expenses related to the previously disclosed review conducted by the Company's Audit Committee, executive severance expenses and other items that impact FFO comparability of ($7.0) million, or ($0.02) per diluted share.
Same Property NOI Growth

- Same property NOI for the three months ended June 30, 2017 increased 1.3% from the comparable 2016 period.
- Same property base rent for the three months ended June 30, 2017 contributed 260 basis points to same property NOI growth.
- Same property NOI for the six months ended June 30, 2017 increased 2.3% from the comparable 2016 period.
- Same property base rent for the six months ended June 30, 2017 contributed 250 basis points to same property NOI growth.
Dividend
- The Company's Board of Directors declared a quarterly cash dividend of $0.26 per common share (equivalent to $1.04 per annum) for the third quarter of 2017.
- The dividend is payable on October 16, 2017 to stockholders of record on October 5, 2017, representing an ex-dividend date of October 4, 2017.
PORTFOLIO AND INVESTMENT ACTIVITY
Value Enhancing Reinvestment Opportunities
- During the three months ended June 30, 2017, the Company completed two anchor space repositioning projects and added six new projects to its in process pipeline. At June 30, 2017, the anchor space repositioning in process pipeline was comprised of 21 projects with an aggregate net estimated cost of approximately $44.0 million at expected average incremental NOI yields of 12 to 14%.
- During the three months ended June 30, 2017, the Company completed two outparcel developments and added one new project to its in process pipeline. At June 30, 2017, the outparcel development in process pipeline was comprised of six projects with an aggregate net estimated cost of approximately $10.3 million at an expected average incremental NOI yield of 12%. In addition, the new development in process pipeline was comprised of one project, with a net estimated cost of approximately $37.8 million at an expected NOI yield of 9%.
- During the three months ended June 30, 2017, the Company added one new redevelopment project to its in process pipeline. At June 30, 2017, the redevelopment in process pipeline was comprised of 12 projects with an aggregate net estimated cost of approximately $165.4 million at an expected average incremental NOI yield of 9%.
Acquisitions
- During the three months ended June 30, 2017, the Company acquired two outparcels and one building at existing shopping centers for a combined purchase price of $6.9 million.
Dispositions
- During the three months ended June 30, 2017, the Company generated approximately $75.5 million of gross proceeds on the sale of five assets, including Eustis Village located in Eustis, Florida, McKinley Plaza located in Hamburg, New York, Fitchburg Ridge Shopping Center located in Fitchburg, Wisconsin and WalMart parcels at Liberty Plaza located in Randallstown, Maryland and at Market Centre located in Goshen, Indiana.
- In July 2017, the Company generated approximately $20.8 million of additional gross proceeds on the sale of Frankfort Crossing Shopping Center in Frankfort, Illinois.
CAPITAL STRUCTURE
- During the three months ended June 30, 2017, the Company's Operating Partnership, Brixmor Operating Partnership LP, issued $500.0 million aggregate principal amount of 3.650% Senior Notes due 2024 at 99.576% of par value. Proceeds from the offering were utilized to prepay $283.3 million of secured mortgages and $100.0 million of the Company's Tranche A Term Loan maturing July 31, 2018 and to repay amounts outstanding under the Company's $1.25 billion unsecured revolving credit facility.
- The Company also announced today that its Operating Partnership entered into a new $300.0 million variable rate unsecured term loan facility. The term loan facility has a seven-year term maturing on July 26, 2024, with no available extension options, and will bear interest at an effective interest rate of Libor plus 190 basis points (based on the Operating Partnership's current credit ratings). Proceeds from the term loan facility were used to prepay $300.0 million of the Company's Tranche A Term Loan maturing July 31, 2018.
- Wells Fargo Securities, LLC, PNC Capital Markets LLC, U.S. Bank National Association, Bank of Montreal and SunTrust Robinson Humphrey, Inc. served collectively as lead arrangers, with Wells Fargo Bank, National Association serving as administrative agent, PNC Bank, National Association and U.S. Bank National Association serving as co-syndication agents and Bank of Montreal and SunTrust Bank serving as co-documentation agents.
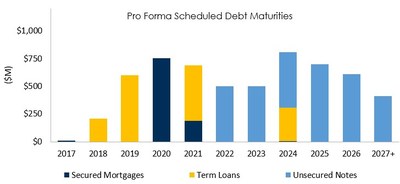
- On a pro forma basis, the Company extended its weighted average maturity to 5.6 years, while reducing scheduled maturing debt in 2018 to $210.0 million from $1.0 billion at December 31, 2016. A pro forma maturity chart follows:
LITIGATION
- During the three months ended June 30, 2017, the Company entered into a preliminary agreement to settle the putative securities class action complaint filed in March 2016 related to the previously disclosed review conducted by the Company's Audit Committee. The settlement amount is within the coverage amount of the Company's applicable insurance policies. There can be no assurance that a final settlement agreement will be reached or that any such settlement will be approved by the Court.
GUIDANCE
- The Company is affirming its previously provided NAREIT FFO per diluted share expectations for 2017. Key underlying assumptions are updated as indicated below.
| 2017E (dollars in millions, except per share amounts) | | Updated Guidance | | Prior Guidance |
| NAREIT FFO per diluted share (1) | | $2.05 - $2.12 | | $2.05 - $2.12 |
| Key Underlying Assumptions: | | | | |
| Same property NOI growth | | 2.0 - 3.0% | | 2.0 - 3.0% |
| Straight-line rental income, amortization of above- and below-market rent and tenant inducements and straight-line ground rent expense | | $44 - $46 | | $40 - $44 |
| General and administrative expenses (1)(2) | | $88 - $92 | | $86 - $90 |
| GAAP interest expense (3) | | $228 - $230 | | $226 - $230 |
| Value enhancing capital expenditures | | $110 - $135 | | $120 - $150 |
(1) Does not include any expectations of additional one-time items, including, but not limited to, litigation, investigative and other non-routine legal expenses.
(2) Increase reflects actual litigation and other non-routine legal expenses recognized year-to-date.
(3) Does not include any expectations of additional deleveraging activity.
- The following table provides a reconciliation of the range of the Company's 2017 estimated net income attributable to common stockholders to NAREIT FFO:
| (Unaudited, dollars in millions, except per share amounts) | | 2017E | | 2017E Per Diluted Share |
| Net income attributable to common stockholders | | $271 - $292 | | $0.89 - $0.96 |
| Depreciation and amortization | | 368 | | 1.20 |
| Impairment of operating properties | | 16 | | 0.05 |
| Gain on disposition of operating properties | | (29) | | (0.09) |
| NAREIT FFO | | $626 - $647 | | $2.05 - $2.12 |
CONNECT WITH BRIXMOR
- For additional information, please visit www.brixmor.com;
- Follow Brixmor on Twitter at www.twitter.com/Brixmor;
- Find Brixmor on LinkedIn at www.linkedin.com/company/brixmor.
CONFERENCE CALL AND SUPPLEMENTAL INFORMATION
The Company will host a teleconference on Tuesday, August 1, 2017 at 9:00 AM ET. To participate, please dial 888.317.6003 (domestic) or 412.317.6061 (international) at least ten minutes prior to the scheduled start of the call (Passcode: 5285588). The teleconference can also be accessed via a live webcast at www.brixmor.com in the Investors section. A replay of the teleconference will be available through midnight ET on August 15, 2017 by dialing 877.344.7529 (domestic) or 412.317.0088 (international) (Passcode: 10108356) or via the web through August 1, 2018 at www.brixmor.com in the Investors section.
The Company's Supplemental Disclosure will be posted at www.brixmor.com in the Investors section. These materials are also available to all interested parties upon request to the Company at investorrelations@brixmor.com or 800.468.7526.
NON-GAAP DISCLOSURES
NAREIT FFO
NAREIT FFO is a supplemental non-GAAP performance measure utilized to evaluate the operating performance of real estate companies. The National Association of Real Estate Investment Trusts ("NAREIT") defines FFO as net income (loss) presented in accordance with GAAP excluding (i) gain (loss) on disposition of operating properties, and (ii) extraordinary items, plus (iii) depreciation and amortization of operating properties, (iv) impairment of operating properties and real estate equity investments, and (v) after adjustments for unconsolidated joint ventures calculated to reflect FFO on the same basis.
The Company presents NAREIT FFO as it considers it an important supplemental measure of its operational and financial performance. The Company believes NAREIT FFO assists investors in analyzing Brixmor's comparative operational and financial performance because, by excluding gains and losses related to dispositions of previously depreciated operating properties, real estate-related depreciation and amortization of continuing operations, impairment of operating properties and real estate equity investments, extraordinary items, and after adjustments for joint ventures calculated to reflect FFO on the same basis, investors can compare the operational performance of a company's real estate between periods.
NAREIT FFO should not be considered as an alternative to, or more meaningful than, net income (presented in accordance with GAAP) or other GAAP financial measures, as an indicator of financial performance and is not an alternative to, or more meaningful than, cash flow from operating activities (presented in accordance with GAAP) as a measure of liquidity.
Non-GAAP performance measures have limitations as they do not include all items of income and expense that affect operations, and accordingly, should always be considered as supplemental financial results to those presented in accordance with GAAP. Computation of NAREIT FFO may differ in certain respects from the methodology utilized by other REITs and, therefore, may not be comparable to similarly titled measures presented by such other REITs. Investors are cautioned that items excluded from NAREIT FFO are relevant to understanding and addressing financial performance. A reconciliation of NAREIT FFO to net income is presented in the attached table.
Same Property NOI
Same property NOI is a supplemental, non-GAAP performance measure utilized to evaluate the operating performance of real estate companies. Same property NOI is calculated (using properties owned for the entirety of both periods excluding properties under development), as total property revenues (base rent, ancillary and other, expense reimbursements, and percentage rents) less direct property operating expenses (operating costs, real estate taxes and provision for doubtful accounts). Same property NOI includes the Company's unconsolidated joint venture at pro rata share. Same property NOI excludes corporate level income (including management, transaction, and other fees), lease termination fees, straight-line rental income, amortization of above- and below-market rent and tenant inducements, straight-line ground rent expense and income / expense associated with the Company's captive insurance entity.
Same property NOI eliminates disparities in NOI due to the acquisition, disposition or stabilization of development properties during the period presented, and therefore, provides a more consistent metric for comparing operational performance. Management uses same property NOI to review operational results for comparative purposes with respect to previous periods or forecasts, and also to evaluate future prospects.
Same property NOI should not be considered as an alternative to, or more meaningful than, net income (presented in accordance with GAAP) or other GAAP financial measures as an indicator of financial performance and is not an alternative to, or more meaningful than, cash flow from operating activities (presented in accordance with GAAP) as a measure of liquidity.
Non-GAAP performance measures have limitations as they do not include all items of income and expense that affect operations, and accordingly, should always be considered as supplemental financial results to those presented in accordance with GAAP. Computation of same property NOI may differ in certain respects from the methodology utilized by other REITs and, therefore, may not be comparable to similarly titled measures presented by such other REITs. Investors are cautioned that items excluded from same property NOI are relevant to understanding and addressing financial performance. A reconciliation of same property NOI to net income is presented in the attached table.
ABOUT BRIXMOR PROPERTY GROUP
Brixmor Property Group, a real estate investment trust (REIT), is a leading owner and operator of high-quality, open-air shopping centers. The Company's more than 500 retail centers comprise 85 million square feet in established trade areas across the nation and are supported by a diverse mix of highly productive non-discretionary and value-oriented retailers, as well as consumer-oriented service providers. Brixmor is committed to maximizing the value of its portfolio by prioritizing investments, cultivating relationships and capitalizing on embedded growth opportunities through driving rents, increasing occupancy and pursuing value-enhancing reinvestment opportunities. Headquartered in New York City, Brixmor is a partner to more than 5,500 best-in-class national, regional and local tenants and is the largest landlord to The TJX Companies and The Kroger Company.
SAFE HARBOR LANGUAGE
This press release may contain forward-looking statements within the meaning of Section 27A of the Securities Act of 1933 and Section 21E of the Securities Exchange Act of 1934. These statements include, but are not limited to, statements related to the Company's expectations regarding the performance of its business, its financial results, its liquidity and capital resources and other non-historical statements. You can identify these forward-looking statements by the use of words such as "outlook," "believes," "expects," "potential," "continues," "may," "will," "should," "seeks," "approximately," "projects," "predicts," "intends," "plans," "estimates," "anticipates" or the negative version of these words or other comparable words. Such forward-looking statements are subject to various risks and uncertainties, including those described under the section entitled "Risk Factors" in the Company's Annual Report on Form 10-K for the year ended December 31, 2016, as such factors may be updated from time to time in our periodic filings with the SEC, which are accessible on the SEC's website at www.sec.gov. Accordingly, there are or will be important factors that could cause actual outcomes or results to differ materially from those indicated in these statements. These factors should not be construed as exhaustive and should be read in conjunction with the other cautionary statements that are included in this release and in the Company's filings with the SEC. The Company undertakes no obligation to publicly update or review any forward-looking statement, whether as a result of new information, future developments or otherwise, except as required by law.
| CONSOLIDATED BALANCE SHEETS | | | |||||
| Unaudited, dollars in thousands, except share information | | | |||||
| | | | | | | | |
| | | | | As of | | As of | |
| | | | | 6/30/17 | | 12/31/16 | |
| | Assets | | | | |||
| | | Real estate | | | | ||
| | | | Land | $ 2,005,648 | | $ 2,006,655 | |
| | | | Buildings and tenant improvements | 8,135,450 | | 8,043,855 | |
| | | | Construction in progress | 55,318 | | 121,817 | |
| | | | Lease intangibles Werbung Mehr Nachrichten zur Brixmor Property Group Inc Aktie kostenlos abonnieren
E-Mail-Adresse
Bitte überprüfe deine die E-Mail-Adresse.
Benachrichtigungen von ARIVA.DE (Mit der Bestellung akzeptierst du die Datenschutzhinweise) -1  Vielen Dank, dass du dich für unseren Newsletter angemeldet hast. Du erhältst in Kürze eine E-Mail mit einem Aktivierungslink. Hinweis: ARIVA.DE veröffentlicht in dieser Rubrik Analysen, Kolumnen und Nachrichten aus verschiedenen Quellen. Die ARIVA.DE AG ist nicht verantwortlich für Inhalte, die erkennbar von Dritten in den „News“-Bereich dieser Webseite eingestellt worden sind, und macht sich diese nicht zu Eigen. Diese Inhalte sind insbesondere durch eine entsprechende „von“-Kennzeichnung unterhalb der Artikelüberschrift und/oder durch den Link „Um den vollständigen Artikel zu lesen, klicken Sie bitte hier.“ erkennbar; verantwortlich für diese Inhalte ist allein der genannte Dritte. Andere Nutzer interessierten sich auch für folgende News | ||||


