
Top-News
Freitag,
13.04.2018 14:00
von
PR Newswire
| Aufrufe: 66
Alaska Air Group reports March 2018 operational results
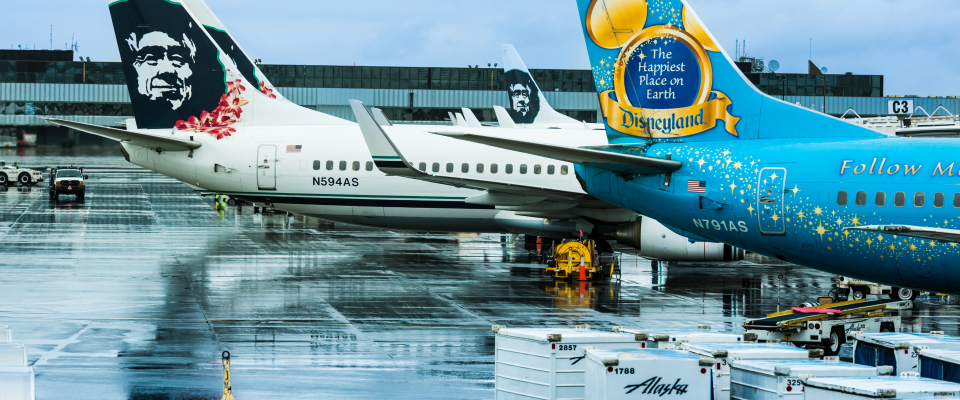
Flugzeuge von der Alaska Air Group am Flughafen Anchorage.
© LaraBelova / iStock Unreleased Getty Images Plus / Getty Images
https://www.gettyimages.de/
PR Newswire
SEATTLE, April 13, 2018
SEATTLE, April 13, 2018 /PRNewswire/ -- Alaska Air Group Inc. (NYSE: ALK) today reported March and year-to-date operational results on a consolidated basis for its mainline operations flown by subsidiaries Alaska Airlines Inc. (Alaska) and Virgin America Inc. (Virgin America), and for its regional flying operated by subsidiary Horizon Air Industries Inc. (Horizon) and third-party regional carriers SkyWest Airlines and Peninsula Airlines.
On Jan. 11, 2018, Alaska and Virgin America consolidated their operations onto a Single Operating Certificate (SOC). Results for Alaska and Virgin America have been combined into a single mainline operation.
AIR GROUP
On a combined basis for all operations, Air Group reported a 6.5 percent increase in traffic on a 7.2 percent increase in capacity compared to March 2017. Load factor decreased 0.5 points to 84.9 percent.
The following table shows the operational results for March and year-to-date, compared to the prior-year periods:
| | March | | Year-to-Date | ||||||||
| | 2018 | | 2017 | | Change | | 2018 | | 2017 | | Change |
| Revenue passengers (000) | 3,920 | | 3,737 | | 4.9% | | 10,489 | | 10,008 | | 4.8% |
| Revenue passenger miles RPM (000,000) "traffic" | 4,654 | | 4,369 | | 6.5% | | 12,403 | | 11,707 | | 5.9% |
| Available seat miles ASM (000,000) "capacity" | 5,485 | | 5,116 | | 7.2% | | 15,480 | | 14,394 | | 7.5% |
| Passenger load factor | 84.9% | | 85.4% | | (0.5) pts | | 80.1% | | 81.3% | | (1.2) pts |

MAINLINE
Mainline reported a 5.4 percent increase in traffic on a 6 percent increase in capacity compared to March 2017. Load factor decreased 0.5 points to 85.4 percent. Mainline also reported 81.9 percent of its flights arrived on time in March 2018, compared to 75.9 percent reported in March 2017.
Mainline operational results reflect both Alaska and Virgin America combined. The following table shows mainline operational results for March and year-to-date, compared to the prior-year periods:
| | March | | Year-to-Date | ||||||||
| | 2018 | | 2017 | | Change | | 2018 | | 2017 | | Change |
| Revenue passengers (000) | 3,085 | | 2,906 | | 6.2% | | 8,211 | | 7,774 | | 5.6% |
| RPMs (000,000) | 4,256 | | 4,039 | | 5.4% | | 11,360 | | 10,827 | | 4.9% |
| ASMs (000,000) | 4,985 | | 4,704 | | 6.0% | | 14,098 | | 13,260 | | 6.3% |
| Passenger load factor | 85.4% | | 85.9% | | (0.5) pts | | 80.6% | | 81.7% | | (1.1) pts |
| On-time arrivals as reported to U.S. DOT | 81.9% | | 75.9% | | 6.0 pts | | 84.4% | | 74.6% | | 9.8 pts |
REGIONAL
Regional traffic increased 20.6 percent on a 21.4 percent increase in capacity compared to March 2017. Load factor decreased 0.4 points to 79.7 percent. Alaska's regional partners also reported 86.7 percent of its flights arrived on time in March 2018, compared to 84.2 percent in March 2017.
The following table shows regional operational results for March and year-to-date, compared to the prior-year periods:
| | March | | Year-to-Date | ||||||||
| | 2018 | | 2017 | | Change | | 2018 | | 2017 | | Change Werbung Mehr Nachrichten zur Alaska Air Group Aktie kostenlos abonnieren
E-Mail-Adresse
Bitte überprüfe deine die E-Mail-Adresse.
Benachrichtigungen von ARIVA.DE (Mit der Bestellung akzeptierst du die Datenschutzhinweise) -1  Vielen Dank, dass du dich für unseren Newsletter angemeldet hast. Du erhältst in Kürze eine E-Mail mit einem Aktivierungslink. Hinweis: ARIVA.DE veröffentlicht in dieser Rubrik Analysen, Kolumnen und Nachrichten aus verschiedenen Quellen. Die ARIVA.DE AG ist nicht verantwortlich für Inhalte, die erkennbar von Dritten in den „News“-Bereich dieser Webseite eingestellt worden sind, und macht sich diese nicht zu Eigen. Diese Inhalte sind insbesondere durch eine entsprechende „von“-Kennzeichnung unterhalb der Artikelüberschrift und/oder durch den Link „Um den vollständigen Artikel zu lesen, klicken Sie bitte hier.“ erkennbar; verantwortlich für diese Inhalte ist allein der genannte Dritte. Andere Nutzer interessierten sich auch für folgende News |